
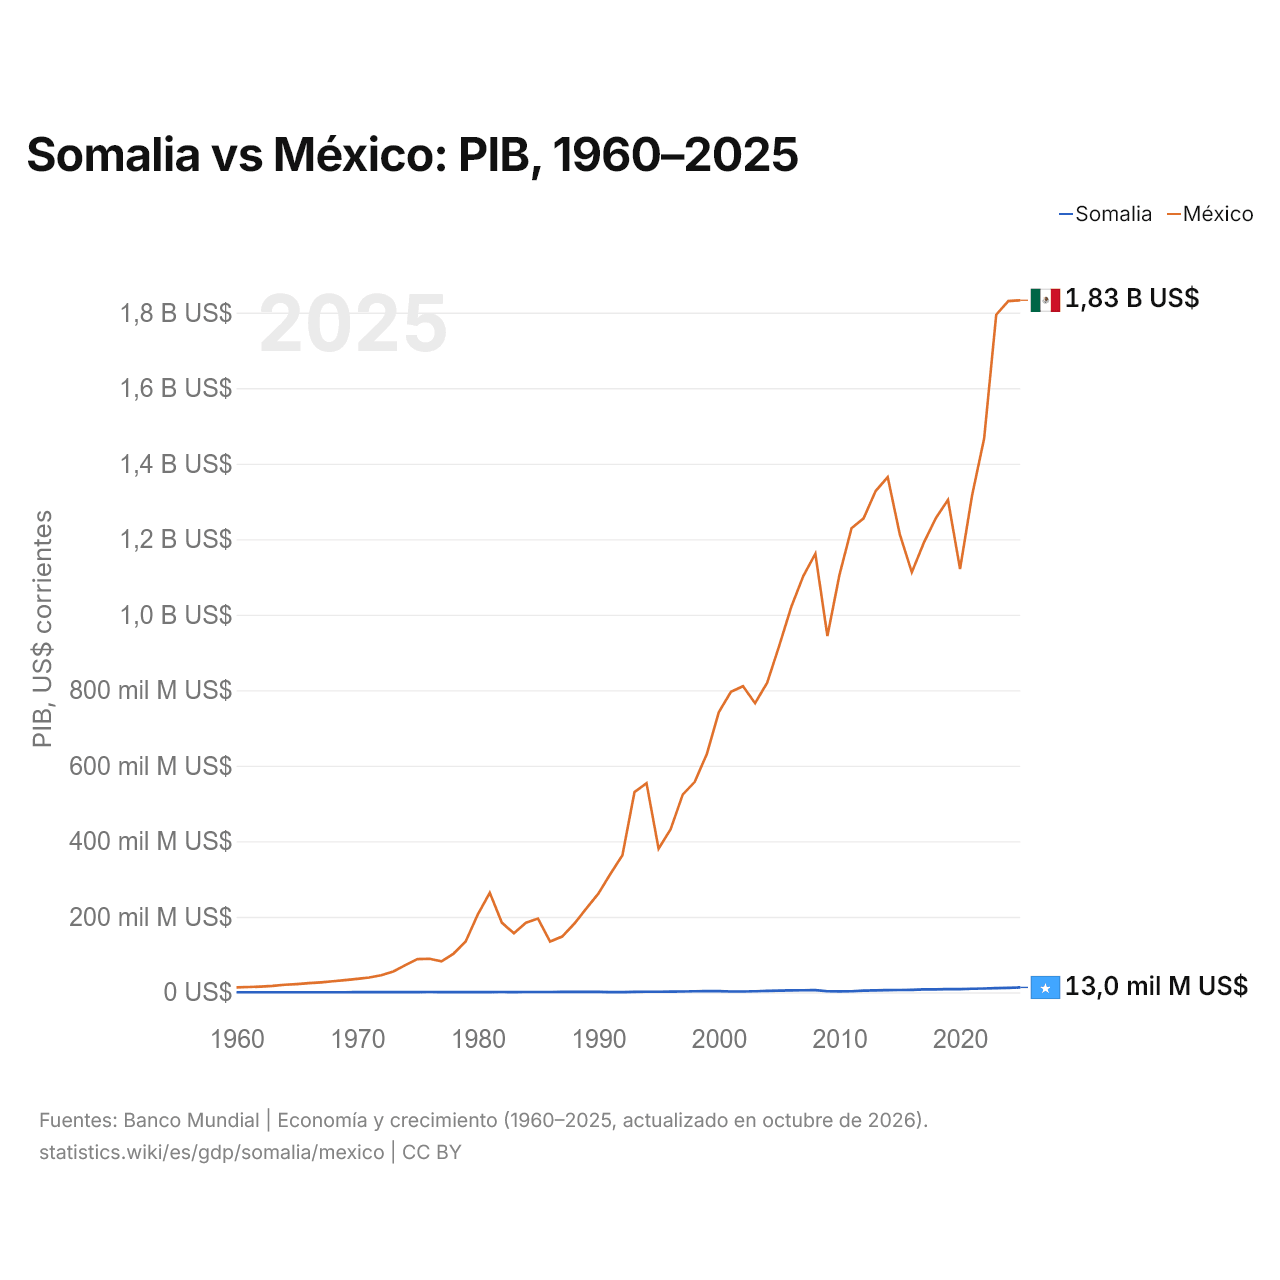
Somalia vs México: PIB, 1960–2025
| Año | PIB, US$ corrientes | |
|---|---|---|
 Somalia |
 México |
|
| 2025 | 12.995.200.000 US$ | 1.832.641.364.776 US$ |
| 2024 | 11.967.000.000 US$ | 1.830.489.311.089 US$ |
| 2023 | 10.958.000.000 US$ | 1.794.410.347.718 US$ |
| 2022 | 10.203.000.000 US$ | 1.466.934.724.243 US$ |
| 2021 | 9.483.000.000 US$ | 1.316.569.466.834 US$ |
| 2020 | 8.628.000.000 US$ | 1.121.064.767.169 US$ |
| 2019 | 8.656.000.000 US$ | 1.304.106.204.006 US$ |
| 2018 | 7.873.000.000 US$ | 1.256.300.182.984 US$ |
| 2017 | 7.621.501.710 US$ | 1.190.721.475.853 US$ |
| 2016 | 6.613.743.070 US$ | 1.112.233.497.453 US$ |
| 2015 | 6.152.149.100 US$ | 1.213.294.467.654 US$ |
| 2014 | 5.728.399.720 US$ | 1.364.507.717.689 US$ |
| 2013 | 5.062.881.600 US$ | 1.327.436.290.439 US$ |
| 2012 | 4.364.670.160 US$ | 1.255.110.424.742 US$ |
| 2011 | 2.906.000.097 US$ | 1.229.013.703.417 US$ |
| 2010 | 2.687.807.004 US$ | 1.105.424.238.652 US$ |
| 2009 | 2.948.594.552 US$ | 943.437.414.951 US$ |
| 2008 | 5.913.620.293 US$ | 1.161.553.459.985 US$ |
| 2007 | 5.430.713.729 US$ | 1.102.355.554.880 US$ |
| 2006 | 5.026.743.282 US$ | 1.020.265.057.882 US$ |
| 2005 | 4.683.246.454 US$ | 917.571.853.437 US$ |
| 2004 | 3.859.592.813 US$ | 819.459.227.375 US$ |
| 2003 | 2.836.724.352 US$ | 765.549.967.889 US$ |
| 2002 | 2.192.684.135 US$ | 810.666.116.402 US$ |
| 2001 | 2.252.847.465 US$ | 796.064.590.549 US$ |
| 2000 | 3.412.797.450 US$ | 742.061.329.749 US$ |
| 1999 | 3.045.751.528 US$ | 631.249.359.702 US$ |
| 1998 | 2.962.047.564 US$ | 557.461.102.631 US$ |
| 1997 | 2.191.749.014 US$ | 523.449.530.464 US$ |
| 1996 | 1.792.234.297 US$ | 432.157.945.024 US$ |
| 1995 | 1.534.756.135 US$ | 380.157.469.867 US$ |
| 1994 | 1.481.205.098 US$ | 553.618.247.901 US$ |
| 1993 | 1.260.132.956 US$ | 530.160.763.663 US$ |
| 1992 | 709.297.579 US$ | 363.157.832.924 US$ |
| 1991 | 717.974.930 US$ | 313.139.656.146 US$ |
| 1990 | 1.031.282.081 US$ | 261.253.675.693 US$ |
| 1989 | 1.181.360.844 US$ | 221.403.098.267 US$ |
| 1988 | 1.051.596.967 US$ | 181.611.150.497 US$ |
| 1987 | 1.018.972.664 US$ | 147.542.558.209 US$ |
| 1986 | 916.590.786 US$ | 134.556.034.673 US$ |
| 1985 | 875.702.247 US$ | 195.241.069.482 US$ |
| 1984 | 787.434.542 US$ | 184.230.754.105 US$ |
| 1983 | 735.408.642 US$ | 156.167.000.433 US$ |
| 1982 | 774.578.932 US$ | 184.602.611.610 US$ |
| 1981 | 699.302.473 US$ | 263.797.827.860 US$ |
| 1980 | 602.515.548 US$ | 205.577.055.466 US$ |
| 1979 | 589.566.929 US$ | 134.531.900.899 US$ |
| 1978 | 564.571.823 US$ | 102.648.570.299 US$ |
| 1977 | 498.550.725 US$ | 81.912.018.784 US$ |
| 1976 | 871.344.245 US$ | 88.875.923.765 US$ |
| 1975 | 757.015.879 US$ | 88.000.000.000 US$ |
| 1974 | 572.504.036 US$ | 72.000.000.000 US$ |
| 1973 | 483.699.611 US$ | 55.280.000.000 US$ |
| 1972 | 447.883.941 US$ | 45.200.000.000 US$ |
| 1971 | 347.039.446 US$ | 39.200.000.000 US$ |
| 1970 | 347.985.394 US$ | 35.520.000.000 US$ |
| 1969 | 306.357.285 US$ | 32.480.000.000 US$ |
| 1968 | 286.719.885 US$ | 29.360.000.000 US$ |
| 1967 | 271.781.887 US$ | 26.560.000.000 US$ |
| 1966 | 257.375.897 US$ | 24.320.000.000 US$ |
| 1965 | 243.725.898 US$ | 21.840.000.000 US$ |
| 1964 | 229.529.913 US$ | 20.080.000.000 US$ |
| 1963 | 216.145.936 US$ | 16.960.000.000 US$ |
| 1962 | 203.531.928 US$ | 15.200.000.000 US$ |
| 1961 | 191.659.914 US$ | 14.160.000.000 US$ |
| 1960 | 180.459.937 US$ | 13.040.000.000 US$ |
En 2025, el PIB de México (1,83 billones de US$) fue 140 veces el de Somalia (13 mil millones de US$). En 2015 era 200 veces. De 2015 a 2025, a precios constantes de 2015, el PIB de México creció un 11,5 % y el de Somalia, un 48,7 %.
Desde 1960, el PIB de México ha sido cada año el mayor de los dos; en 1960, era 72 veces el de Somalia. En 2025, el PIB per cápita fue de 661 US$ en Somalia y de 13.889 US$ en México: 21 veces más alto en México.
Somalia vs México: últimos datos del PIB
|
Somalia
|
México
|
|
|---|---|---|
| PIB, US$ corrientes | 13,0 mil M US$ | 1,83 B US$ |
| Puesto mundial | 149/197 | 14/197 |
| Porcentaje del mundo | 0,01 % | 1,55 % |
| PIB, US$ constantes de 2015 | 9150 M US$ | 1,35 B US$ |
| Diferencia de PIB | 0,0071× | 141× |
Comparar el PIB de 2 países cualesquiera
Fuentes:
- Banco Mundial | Economía y crecimiento (1960–2025, actualizado en octubre de 2026)
Creative Commons Atribución (CC BY): puedes copiar, compartir, adaptar y reutilizar este contenido, también con fines comerciales, siempre que cites a statistics.wiki e indiques los cambios que hayas hecho. Las fuentes indicadas arriba pueden tener sus propias condiciones de licencia.