
Estados Unidos vs Panamá: PIB per cápita, 1960–2025
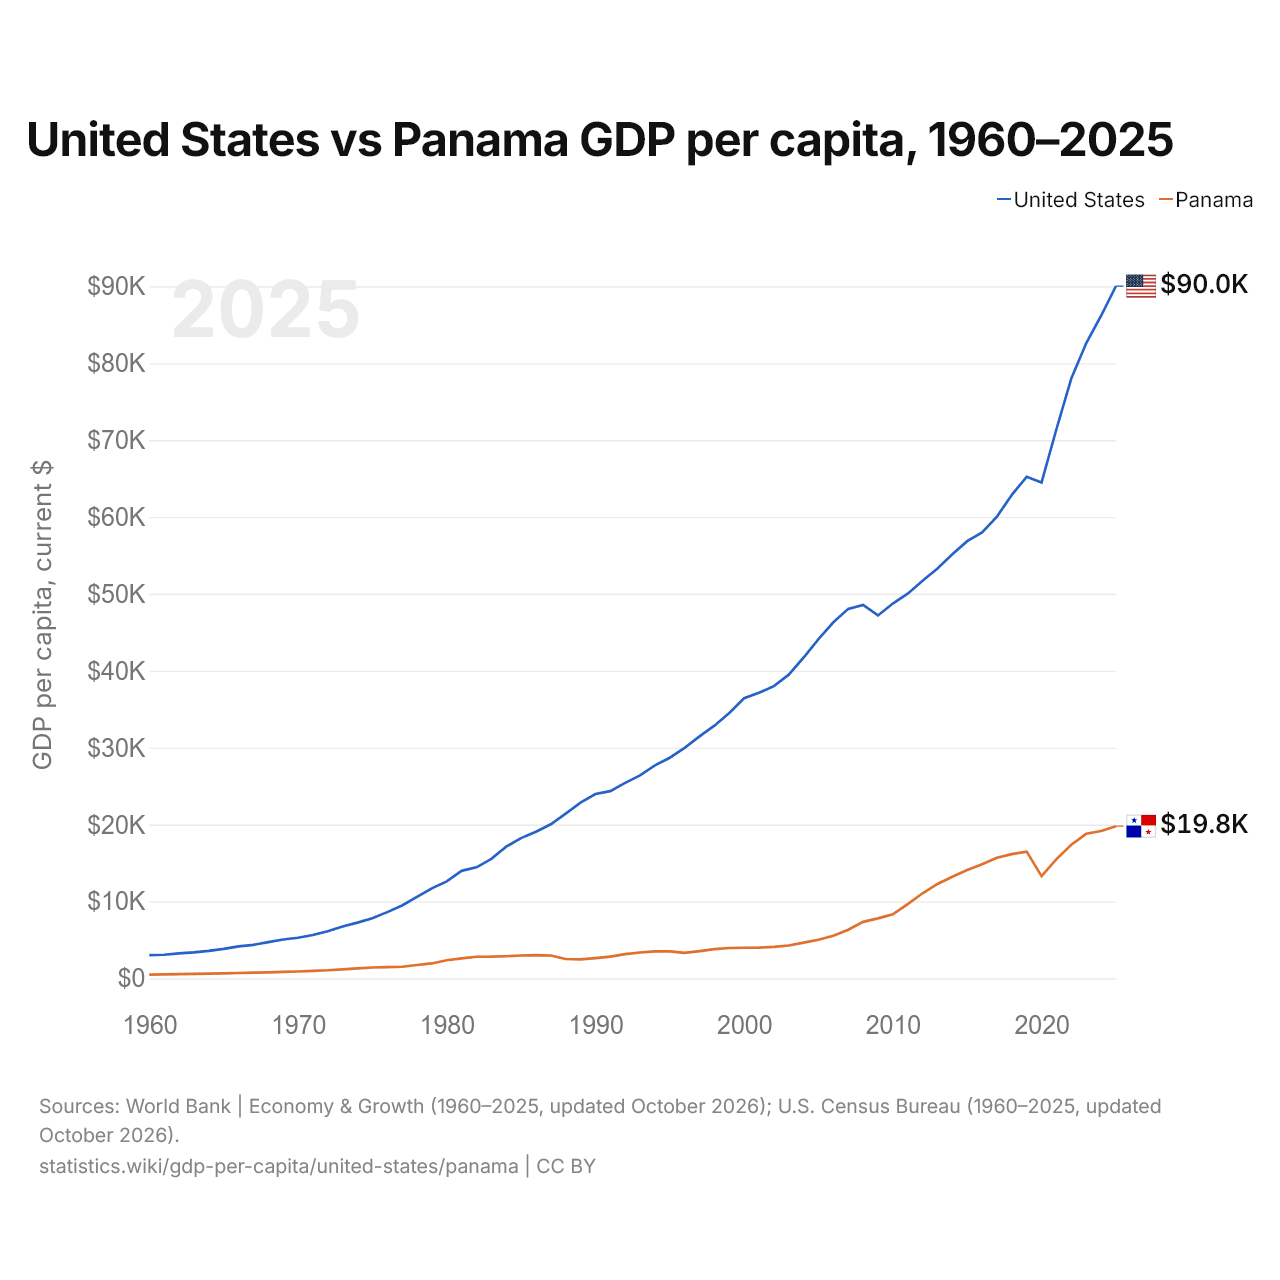
| Año | PIB per cápita, US$ corrientes | |
|---|---|---|
 Estados Unidos |
 Panamá |
|
| 2025 | 90.027 US$ | 19.790 US$ |
| 2024 | 86.170 US$ | 19.161 US$ |
| 2023 | 82.587 US$ | 18.797 US$ |
| 2022 | 78.009 US$ | 17.379 US$ |
| 2021 | 71.441 US$ | 15.510 US$ |
| 2020 | 64.490 US$ | 13.291 US$ |
| 2019 | 65.228 US$ | 16.478 US$ |
| 2018 | 62.876 US$ | 16.151 US$ |
| 2017 | 60.048 US$ | 15.695 US$ |
| 2016 | 57.977 US$ | 14.832 US$ |
| 2015 | 56.849 US$ | 14.083 US$ |
| 2014 | 55.153 US$ | 13.213 US$ |
| 2013 | 53.297 US$ | 12.273 US$ |
| 2012 | 51.708 US$ | 11.065 US$ |
| 2011 | 50.025 US$ | 9.662 US$ |
| 2010 | 48.742 US$ | 8.331 US$ |
| 2009 | 47.195 US$ | 7.797 US$ |
| 2008 | 48.570 US$ | 7.348 US$ |
| 2007 | 48.050 US$ | 6.318 US$ |
| 2006 | 46.302 US$ | 5.529 US$ |
| 2005 | 44.123 US$ | 5.018 US$ |
| 2004 | 41.725 US$ | 4.645 US$ |
| 2003 | 39.490 US$ | 4.265 US$ |
| 2002 | 37.998 US$ | 4.091 US$ |
| 2001 | 37.134 US$ | 3.992 US$ |
| 2000 | 36.426 US$ | 3.975 US$ |
| 1999 | 34.515 US$ | 3.950 US$ |
| 1998 | 32.854 US$ | 3.808 US$ |
| 1997 | 31.460 US$ | 3.546 US$ |
| 1996 | 29.968 US$ | 3.308 US$ |
| 1995 | 28.691 US$ | 3.514 US$ |
| 1994 | 27.695 US$ | 3.508 US$ |
| 1993 | 26.387 US$ | 3.358 US$ |
| 1992 | 25.419 US$ | 3.140 US$ |
| 1991 | 24.342 US$ | 2.821 US$ |
| 1990 | 23.976 US$ | 2.620 US$ |
| 1989 | 22.857 US$ | 2.462 US$ |
| 1988 | 21.417 US$ | 2.509 US$ |
| 1987 | 20.039 US$ | 2.966 US$ |
| 1986 | 19.071 US$ | 3.019 US$ |
| 1985 | 18.237 US$ | 2.972 US$ |
| 1984 | 17.121 US$ | 2.875 US$ |
| 1983 | 15.544 US$ | 2.819 US$ |
| 1982 | 14.434 US$ | 2.811 US$ |
| 1981 | 13.976 US$ | 2.605 US$ |
| 1980 | 12.612 US$ | 2.357 US$ |
| 1979 | 11.700 US$ | 1.938 US$ |
| 1978 | 10.588 US$ | 1.738 US$ |
| 1977 | 9.473 US$ | 1.503 US$ |
| 1976 | 8.611 US$ | 1.457 US$ |
| 1975 | 7.820 US$ | 1.406 US$ |
| 1974 | 7.243 US$ | 1.296 US$ |
| 1973 | 6.744 US$ | 1.164 US$ |
| 1972 | 6.112 US$ | 1.046 US$ |
| 1971 | 5.632 US$ | 979 US$ |
| 1970 | 5.282 US$ | 893 US$ |
| 1969 | 5.052 US$ | 830 US$ |
| 1968 | 4.715 US$ | 778 US$ |
| 1967 | 4.353 US$ | 745 US$ |
| 1966 | 4.157 US$ | 689 US$ |
| 1965 | 3.834 US$ | 651 US$ |
| 1964 | 3.579 US$ | 611 US$ |
| 1963 | 3.380 US$ | 587 US$ |
| 1962 | 3.249 US$ | 546 US$ |
| 1961 | 3.071 US$ | 516 US$ |
| 1960 | 3.022 US$ | 477 US$ |
En 2025, el PIB per cápita fue de 90.027 US$ en Estados Unidos y de 19.790 US$ en Panamá: 4,5 veces más alto en Estados Unidos. En 1960 era de 3022 US$ en Estados Unidos y de 477 US$ en Panamá, 6,3 veces más alto en Estados Unidos.
El PIB per cápita de Estados Unidos ha sido más alto que el de Panamá todos los años desde 1960. A precios constantes de 2015, el PIB per cápita de Estados Unidos en 2025 fue 3,6 veces el de 1960, y el de Panamá, 6,9 veces.
Estados Unidos vs Panamá: últimos datos del PIB per cápita
|
Estados Unidos
|
Panamá
|
|
|---|---|---|
| PIB per cápita, US$ corrientes | 90.027 US$ | 19.790 US$ |
| Puesto mundial | 10/197 | 62/197 |
| PIB per cápita, US$ constantes de 2015 | 67.946 US$ | 17.650 US$ |
| × media mundial | 6,25× | 1,37× |
| Diferencia de PIB per cápita | 4,5× | 0,22× |
Comparar el PIB per cápita de 2 países cualesquiera
Fuentes:
- Banco Mundial | Economía y crecimiento (1960–2025, actualizado en octubre de 2026)
- U.S. Census Bureau (1960–2025, actualizado en octubre de 2026)
Creative Commons Atribución (CC BY): puedes copiar, compartir, adaptar y reutilizar este contenido, también con fines comerciales, siempre que cites a statistics.wiki e indiques los cambios que hayas hecho. Las fuentes indicadas arriba pueden tener sus propias condiciones de licencia.