
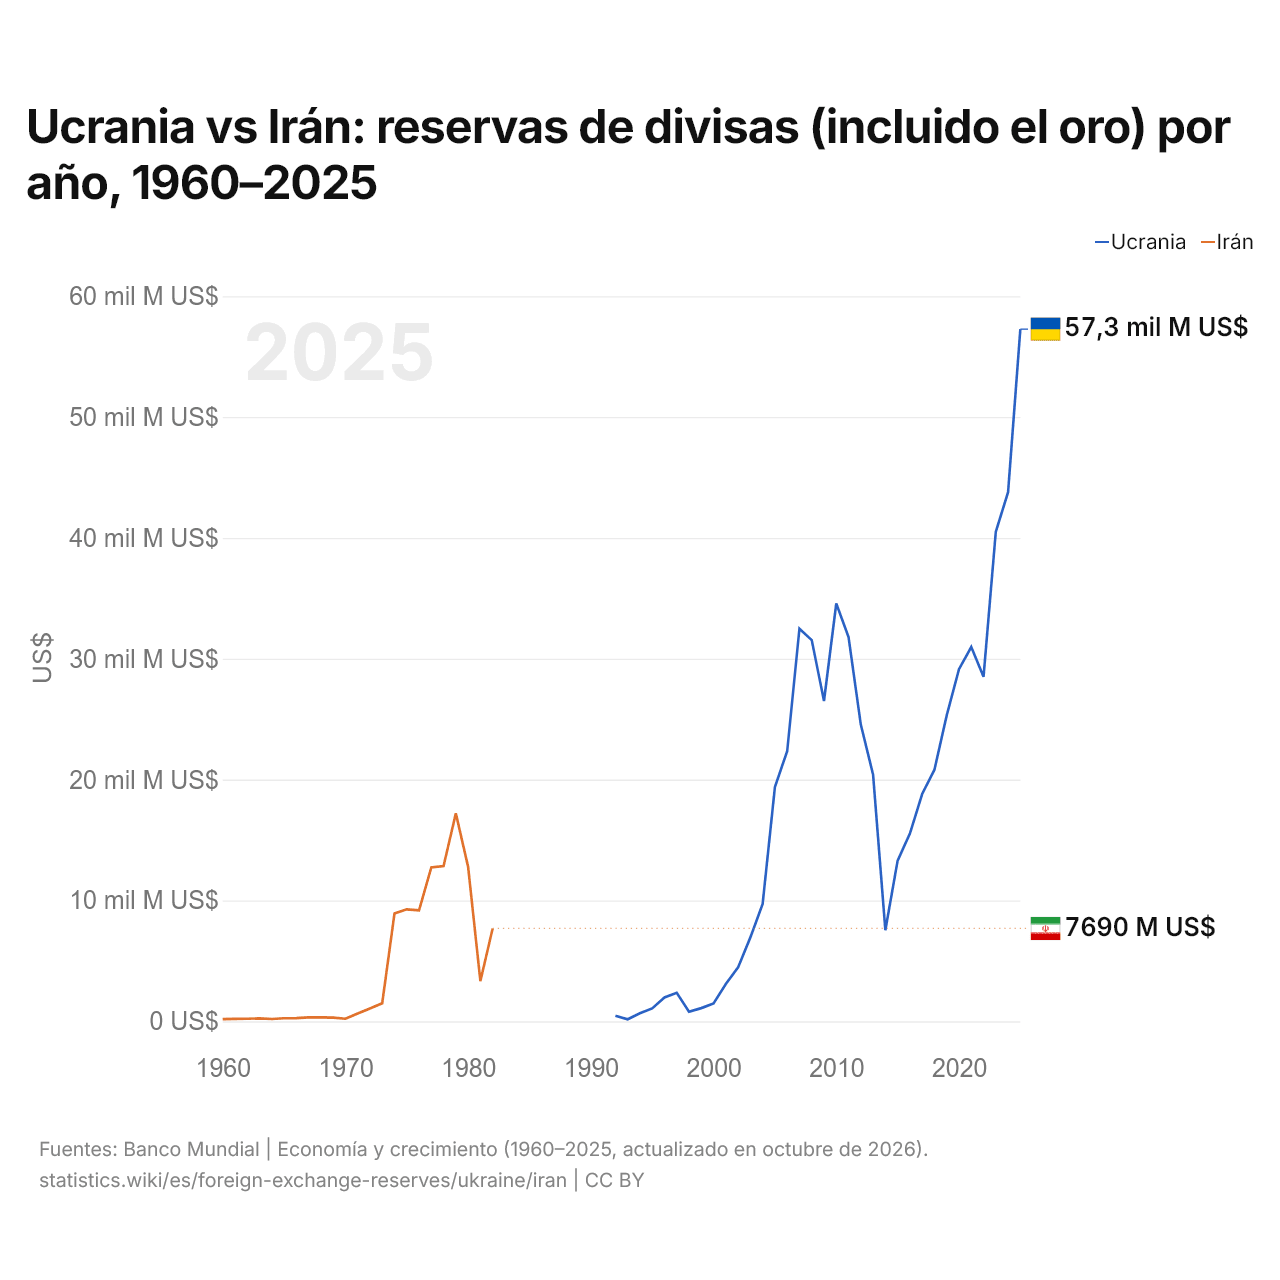
Ucrania vs Irán: reservas de divisas (incluido el oro) por año, 1960–2025
1x
| Año | US$ | |
|---|---|---|
 Ucrania |
 Irán |
|
| 2025 | 57.268.434.039 US$ | - |
| 2024 | 43.780.549.773 US$ | - |
| 2023 | 40.510.106.308 US$ | - |
| 2022 | 28.505.931.892 US$ | - |
| 2021 | 30.966.674.654 US$ | - |
| 2020 | 29.137.541.200 US$ | - |
| 2019 | 25.317.002.927 US$ | - |
| 2018 | 20.817.897.004 US$ | - |
| 2017 | 18.810.931.197 US$ | - |
| 2016 | 15.537.256.304 US$ | - |
| 2015 | 13.300.880.765 US$ | - |
| 2014 | 7.538.804.512 US$ | - |
| 2013 | 20.413.621.999 US$ | - |
| 2012 | 24.552.796.497 US$ | - |
| 2011 | 31.788.750.907 US$ | - |
| 2010 | 34.571.298.928 US$ | - |
| 2009 | 26.500.887.342 US$ | - |
| 2008 | 31.543.343.237 US$ | - |
| 2007 | 32.483.841.813 US$ | - |
| 2006 | 22.359.564.313 US$ | - |
| 2005 | 19.388.177.691 US$ | - |
| 2004 | 9.718.436.096 US$ | - |
| 2003 | 6.946.076.994 US$ | - |
| 2002 | 4.462.353.859 US$ | - |
| 2001 | 3.088.921.703 US$ | - |
| 2000 | 1.477.202.336 US$ | - |
| 1999 | 1.093.527.812 US$ | - |
| 1998 | 792.954.527 US$ | - |
| 1997 | 2.358.910.867 US$ | - |
| 1996 | 1.971.655.947 US$ | - |
| 1995 | 1.068.754.172 US$ | - |
| 1994 | 664.538.695 US$ | - |
| 1993 | 166.106.210 US$ | - |
| 1992 | 468.913.725 US$ | - |
| 1991 | - | - |
| 1990 | - | - |
| 1989 | - | - |
| 1988 | - | - |
| 1987 | - | - |
| 1986 | - | - |
| 1985 | - | - |
| 1984 | - | - |
| 1983 | - | - |
| 1982 | - | 7.685.456.407 US$ |
| 1981 | - | 3.331.695.372 US$ |
| 1980 | - | 12.783.023.465 US$ |
| 1979 | - | 17.207.747.367 US$ |
| 1978 | - | 12.840.645.493 US$ |
| 1977 | - | 12.729.171.532 US$ |
| 1976 | - | 9.184.961.807 US$ |
| 1975 | - | 9.267.871.108 US$ |
| 1974 | - | 8.920.357.632 US$ |
| 1973 | - | 1.498.630.790 US$ |
| 1972 | - | 1.061.180.295 US$ |
| 1971 | - | 642.577.379 US$ |
| 1970 | - | 216.875.910 US$ |
| 1969 | - | 310.902.800 US$ |
| 1968 | - | 322.136.600 US$ |
| 1967 | - | 325.062.800 US$ |
| 1966 | - | 268.925.660 US$ |
| 1965 | - | 251.965.520 US$ |
| 1964 | - | 191.508.480 US$ |
| 1963 | - | 241.829.560 US$ |
| 1962 | - | 210.768.020 US$ |
| 1961 | - | 209.547.100 US$ |
| 1960 | - | 185.218.400 US$ |
Las reservas de divisas de Ucrania son de 57,3 mil millones de US$ (2025), y las de Irán, de 7,69 mil millones de US$ (1982).
Ucrania vs Irán: reservas, incluido el oro, y meses de importaciones cubiertos
|
Ucrania
|
Irán
|
|
|---|---|---|
| Reservas, incluido el oro | 57,3 mil M US$ (2025) | 7690 M US$ (1982) |
| Meses de importaciones | 6,2 (2025) | 3,5 (1982) |
| Puesto mundial | 44/168 | Sin clasificar |
Comparar las reservas de divisas de 2 países cualesquiera
Fuentes:
- Banco Mundial | Economía y crecimiento (1960–2025, actualizado en octubre de 2026)
Creative Commons Atribución (CC BY): puedes copiar, compartir, adaptar y reutilizar este contenido, también con fines comerciales, siempre que cites a statistics.wiki e indiques los cambios que hayas hecho. Las fuentes indicadas arriba pueden tener sus propias condiciones de licencia.