
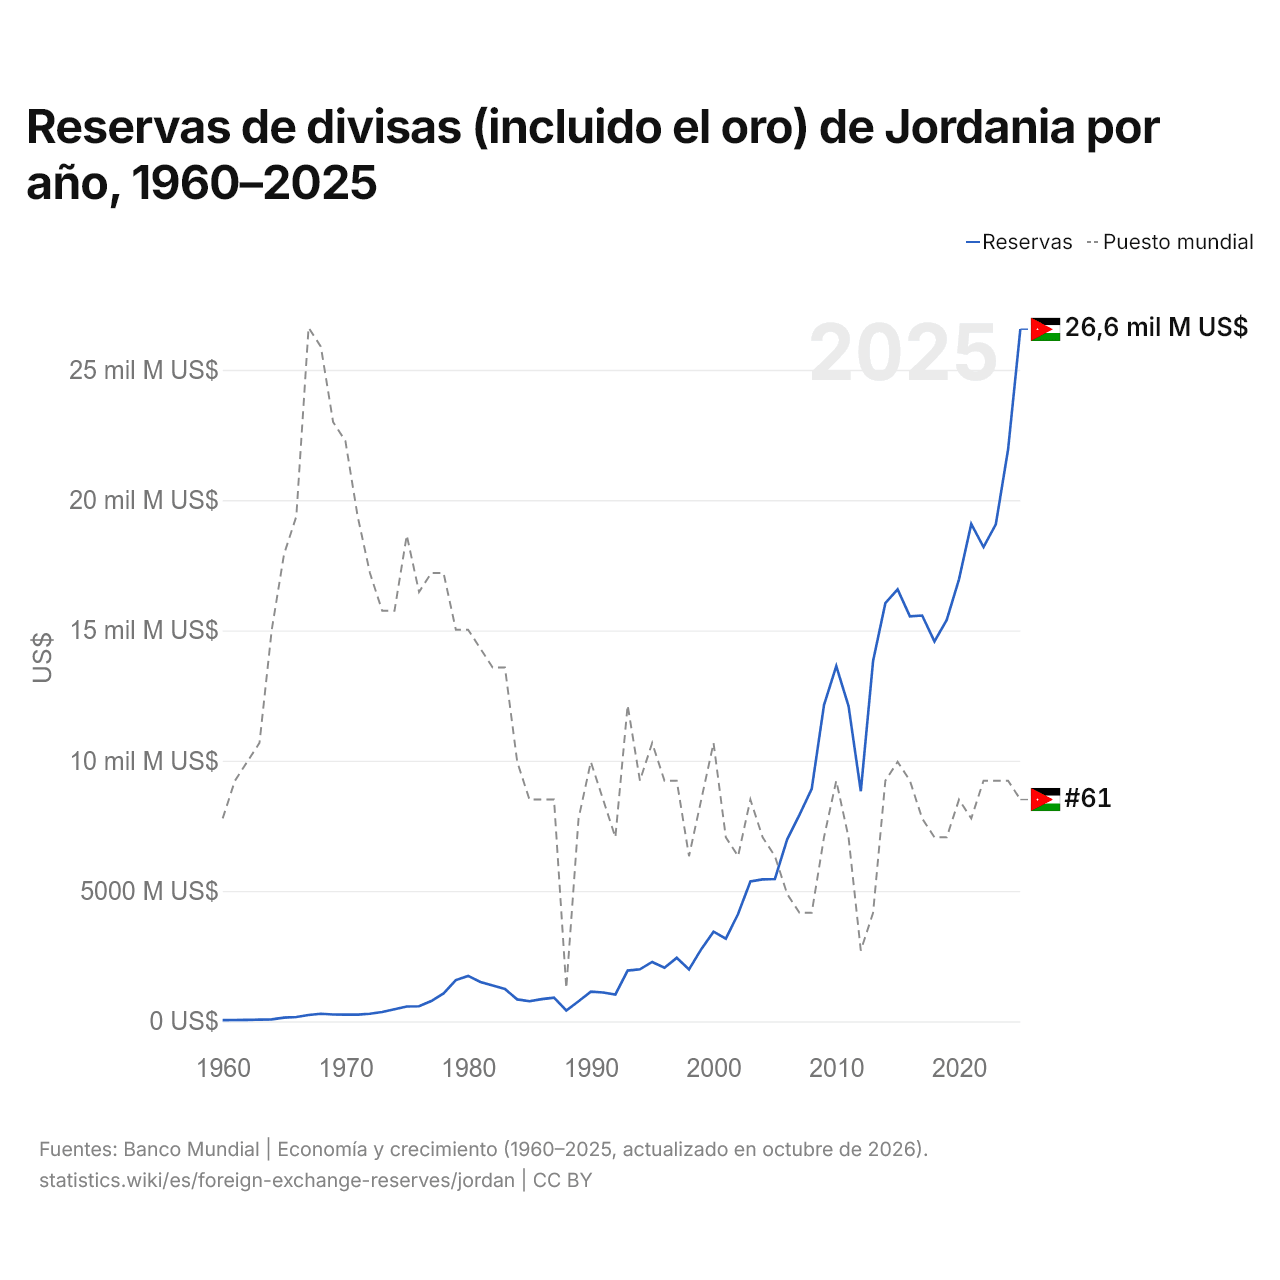
Reservas de divisas (incluido el oro) de Jordania por año, 1960–2025
1x
| Año | US$ | Puesto mundial |
|---|---|---|
| Reservas | ||
| 2025 | 26.557.371.378 US$ | #61 |
| 2024 | 21.939.099.362 US$ | #60 |
| 2023 | 19.068.901.691 US$ | #60 |
| 2022 | 18.198.223.674 US$ | #60 |
| 2021 | 19.089.364.754 US$ | #62 |
| 2020 | 16.961.505.362 US$ | #61 |
| 2019 | 15.400.591.353 US$ | #63 |
| 2018 | 14.580.237.972 US$ | #63 |
| 2017 | 15.571.115.321 US$ | #62 |
| 2016 | 15.543.454.210 US$ | #60 |
| 2015 | 16.571.894.983 US$ | #59 |
| 2014 | 16.047.206.177 US$ | #60 |
| 2013 | 13.826.035.948 US$ | #67 |
| 2012 | 8.830.598.045 US$ | #69 |
| 2011 | 12.094.960.533 US$ | #63 |
| 2010 | 13.632.983.538 US$ | #60 |
| 2009 | 12.135.159.071 US$ | #63 |
| 2008 | 8.918.475.754 US$ | #67 |
| 2007 | 7.924.938.971 US$ | #67 |
| 2006 | 6.982.163.598 US$ | #66 |
| 2005 | 5.461.160.796 US$ | #64 |
| 2004 | 5.446.636.728 US$ | #63 |
| 2003 | 5.365.764.579 US$ | #61 |
| 2002 | 4.116.412.745 US$ | #64 |
| 2001 | 3.174.221.853 US$ | #63 |
| 2000 | 3.441.302.675 US$ | #58 |
| 1999 | 2.770.018.266 US$ | #61 |
| 1998 | 1.988.259.782 US$ | #64 |
| 1997 | 2.435.932.080 US$ | #60 |
| 1996 | 2.054.682.672 US$ | #60 |
| 1995 | 2.279.459.582 US$ | #58 |
| 1994 | 1.996.868.732 US$ | #60 |
| 1993 | 1.946.380.520 US$ | #56 |
| 1992 | 1.030.115.564 US$ | #63 |
| 1991 | 1.104.763.223 US$ | #61 |
| 1990 | 1.138.743.540 US$ | #59 |
| 1989 | 770.634.412 US$ | #62 |
| 1988 | 414.369.578 US$ | #71 |
| 1987 | 909.726.819 US$ | #61 |
| 1986 | 853.055.559 US$ | #61 |
| 1985 | 769.724.329 US$ | #61 |
| 1984 | 841.785.311 US$ | #59 |
| 1983 | 1.239.990.117 US$ | #54 |
| 1982 | 1.377.509.701 US$ | #54 |
| 1981 | 1.510.813.968 US$ | #53 |
| 1980 | 1.744.684.398 US$ | #52 |
| 1979 | 1.583.911.655 US$ | #52 |
| 1978 | 1.068.844.178 US$ | #49 |
| 1977 | 776.098.876 US$ | #49 |
| 1976 | 578.862.216 US$ | #50 |
| 1975 | 570.673.411 US$ | #47 |
| 1974 | 461.452.944 US$ | #51 |
| 1973 | 360.195.580 US$ | #51 |
| 1972 | 292.676.198 US$ | #49 |
| 1971 | 257.685.715 US$ | #46 |
| 1970 | 257.533.890 US$ | #42 |
| 1969 | 262.689.200 US$ | #41 |
| 1968 | 290.247.400 US$ | #37 |
| 1967 | 244.064.400 US$ | #36 |
| 1966 | 167.673.430 US$ | #46 |
| 1965 | 139.846.640 US$ | #48 |
| 1964 | 77.080.000 US$ | #52 |
| 1963 | 62.660.000 US$ | #58 |
| 1962 | 58.050.000 US$ | #59 |
| 1961 | 51.230.000 US$ | #60 |
| 1960 | 46.380.000 US$ | #62 |
En 2025, las reservas de divisas de Jordania fueron de 26,6 mil millones de US$, frente a 46,4 millones de US$ en 1960. Ocuparon el puesto 61 del mundo; en 2024, el 60. Su mejor posición fue el puesto 36, por última vez en 1967.
En 2025, las reservas de divisas de Jordania ocuparon el 23.º puesto entre 43 países de Asia.
Jordania en la clasificación mundial de reservas de divisas (incluido el oro), 2025







Comparar las reservas de divisas de Jordania con otros países
Fuentes:
- Banco Mundial | Economía y crecimiento (1960–2025, actualizado en octubre de 2026)
Creative Commons Atribución (CC BY): puedes copiar, compartir, adaptar y reutilizar este contenido, también con fines comerciales, siempre que cites a statistics.wiki e indiques los cambios que hayas hecho. Las fuentes indicadas arriba pueden tener sus propias condiciones de licencia.