
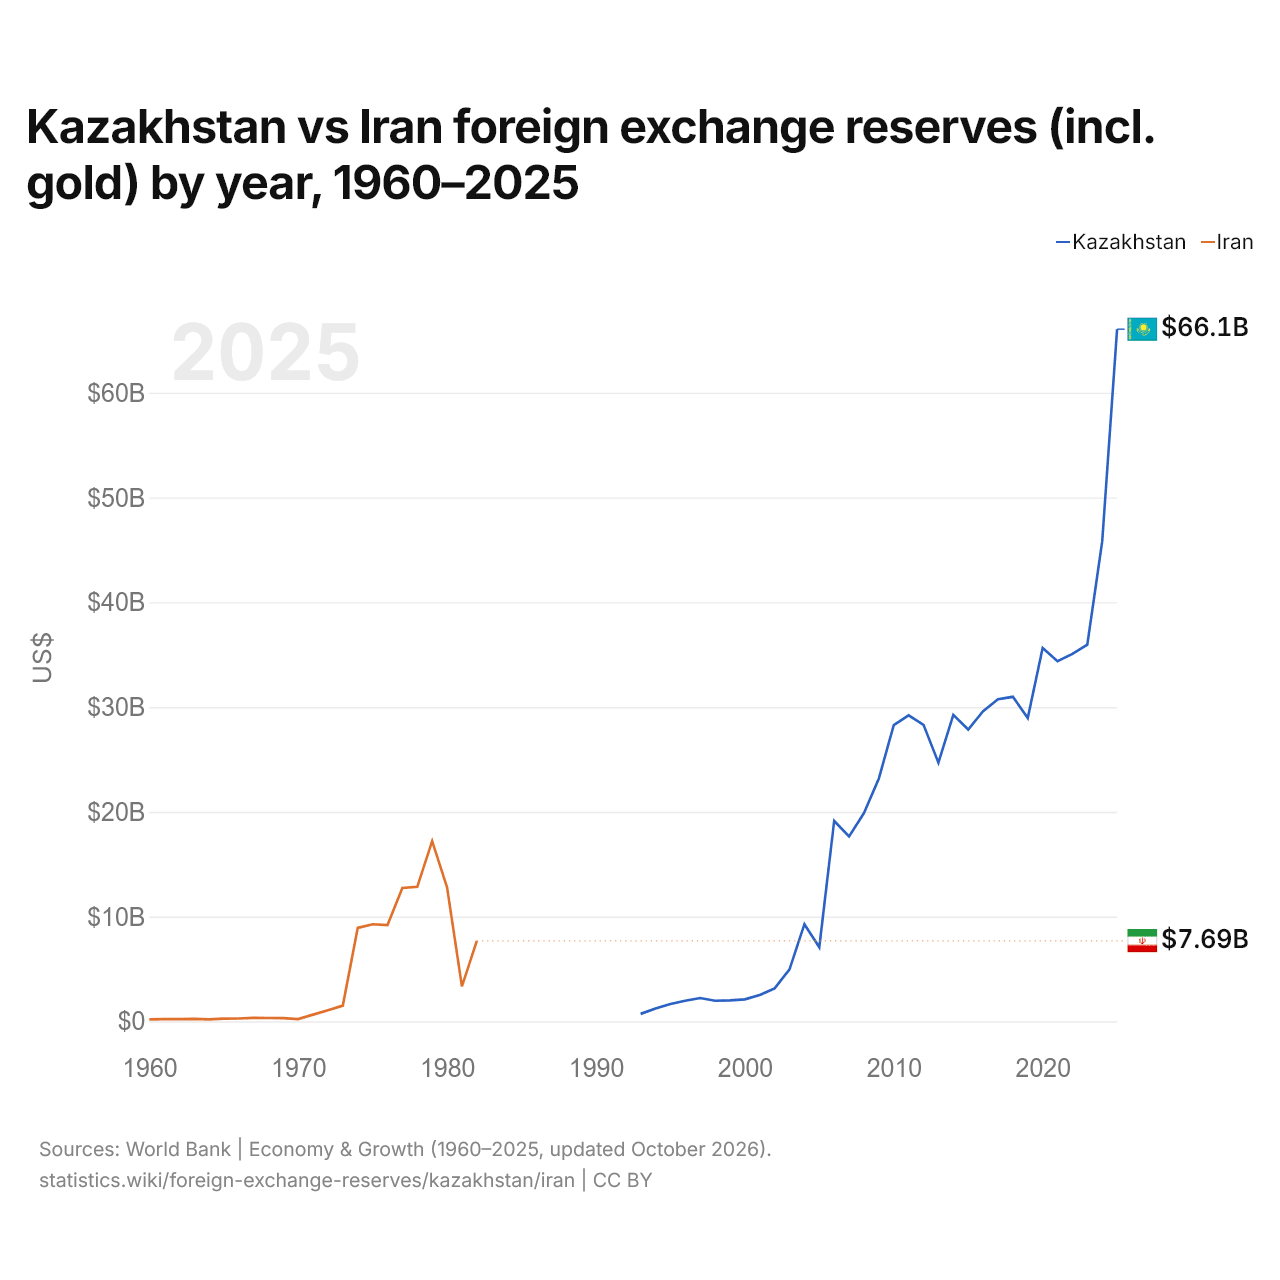
Kazajistán vs Irán: reservas de divisas (incluido el oro) por año, 1960–2025
1x
| Año | US$ | |
|---|---|---|
 Kazajistán |
 Irán |
|
| 2025 | 66.068.640.110 US$ | - |
| 2024 | 45.807.523.139 US$ | - |
| 2023 | 35.964.591.354 US$ | - |
| 2022 | 35.076.053.023 US$ | - |
| 2021 | 34.377.998.806 US$ | - |
| 2020 | 35.638.096.635 US$ | - |
| 2019 | 28.957.509.931 US$ | - |
| 2018 | 30.976.612.439 US$ | - |
| 2017 | 30.746.770.568 US$ | - |
| 2016 | 29.603.056.785 US$ | - |
| 2015 | 27.854.795.819 US$ | - |
| 2014 | 29.250.310.668 US$ | - |
| 2013 | 24.691.645.318 US$ | - |
| 2012 | 28.299.368.221 US$ | - |
| 2011 | 29.215.275.561 US$ | - |
| 2010 | 28.264.709.323 US$ | - |
| 2009 | 23.183.086.501 US$ | - |
| 2008 | 19.883.105.671 US$ | - |
| 2007 | 17.641.023.630 US$ | - |
| 2006 | 19.127.059.972 US$ | - |
| 2005 | 7.069.707.374 US$ | - |
| 2004 | 9.276.665.297 US$ | - |
| 2003 | 4.962.118.090 US$ | - |
| 2002 | 3.140.845.035 US$ | - |
| 2001 | 2.505.883.853 US$ | - |
| 2000 | 2.098.969.799 US$ | - |
| 1999 | 2.000.928.642 US$ | - |
| 1998 | 1.965.445.686 US$ | - |
| 1997 | 2.222.793.380 US$ | - |
| 1996 | 1.960.072.974 US$ | - |
| 1995 | 1.659.893.119 US$ | - |
| 1994 | 1.216.175.913 US$ | - |
| 1993 | 711.198.429 US$ | - |
| 1992 | - | - |
| 1991 | - | - |
| 1990 | - | - |
| 1989 | - | - |
| 1988 | - | - |
| 1987 | - | - |
| 1986 | - | - |
| 1985 | - | - |
| 1984 | - | - |
| 1983 | - | - |
| 1982 | - | 7.685.456.407 US$ |
| 1981 | - | 3.331.695.372 US$ |
| 1980 | - | 12.783.023.465 US$ |
| 1979 | - | 17.207.747.367 US$ |
| 1978 | - | 12.840.645.493 US$ |
| 1977 | - | 12.729.171.532 US$ |
| 1976 | - | 9.184.961.807 US$ |
| 1975 | - | 9.267.871.108 US$ |
| 1974 | - | 8.920.357.632 US$ |
| 1973 | - | 1.498.630.790 US$ |
| 1972 | - | 1.061.180.295 US$ |
| 1971 | - | 642.577.379 US$ |
| 1970 | - | 216.875.910 US$ |
| 1969 | - | 310.902.800 US$ |
| 1968 | - | 322.136.600 US$ |
| 1967 | - | 325.062.800 US$ |
| 1966 | - | 268.925.660 US$ |
| 1965 | - | 251.965.520 US$ |
| 1964 | - | 191.508.480 US$ |
| 1963 | - | 241.829.560 US$ |
| 1962 | - | 210.768.020 US$ |
| 1961 | - | 209.547.100 US$ |
| 1960 | - | 185.218.400 US$ |
Las reservas de divisas de Kazajistán son de 66,1 mil millones de US$ (2025), y las de Irán, de 7,69 mil millones de US$ (1982).
Kazajistán vs Irán: reservas, incluido el oro, y meses de importaciones cubiertos
|
Kazajistán
|
Irán
|
|
|---|---|---|
| Reservas, incluido el oro | 66,1 mil M US$ (2025) | 7690 M US$ (1982) |
| Meses de importaciones | 9,9 (2025) | 3,5 (1982) |
| Puesto mundial | 40/168 | Sin clasificar |
Comparar las reservas de divisas de 2 países cualesquiera
Fuentes:
- Banco Mundial | Economía y crecimiento (1960–2025, actualizado en octubre de 2026)
Creative Commons Atribución (CC BY): puedes copiar, compartir, adaptar y reutilizar este contenido, también con fines comerciales, siempre que cites a statistics.wiki e indiques los cambios que hayas hecho. Las fuentes indicadas arriba pueden tener sus propias condiciones de licencia.