
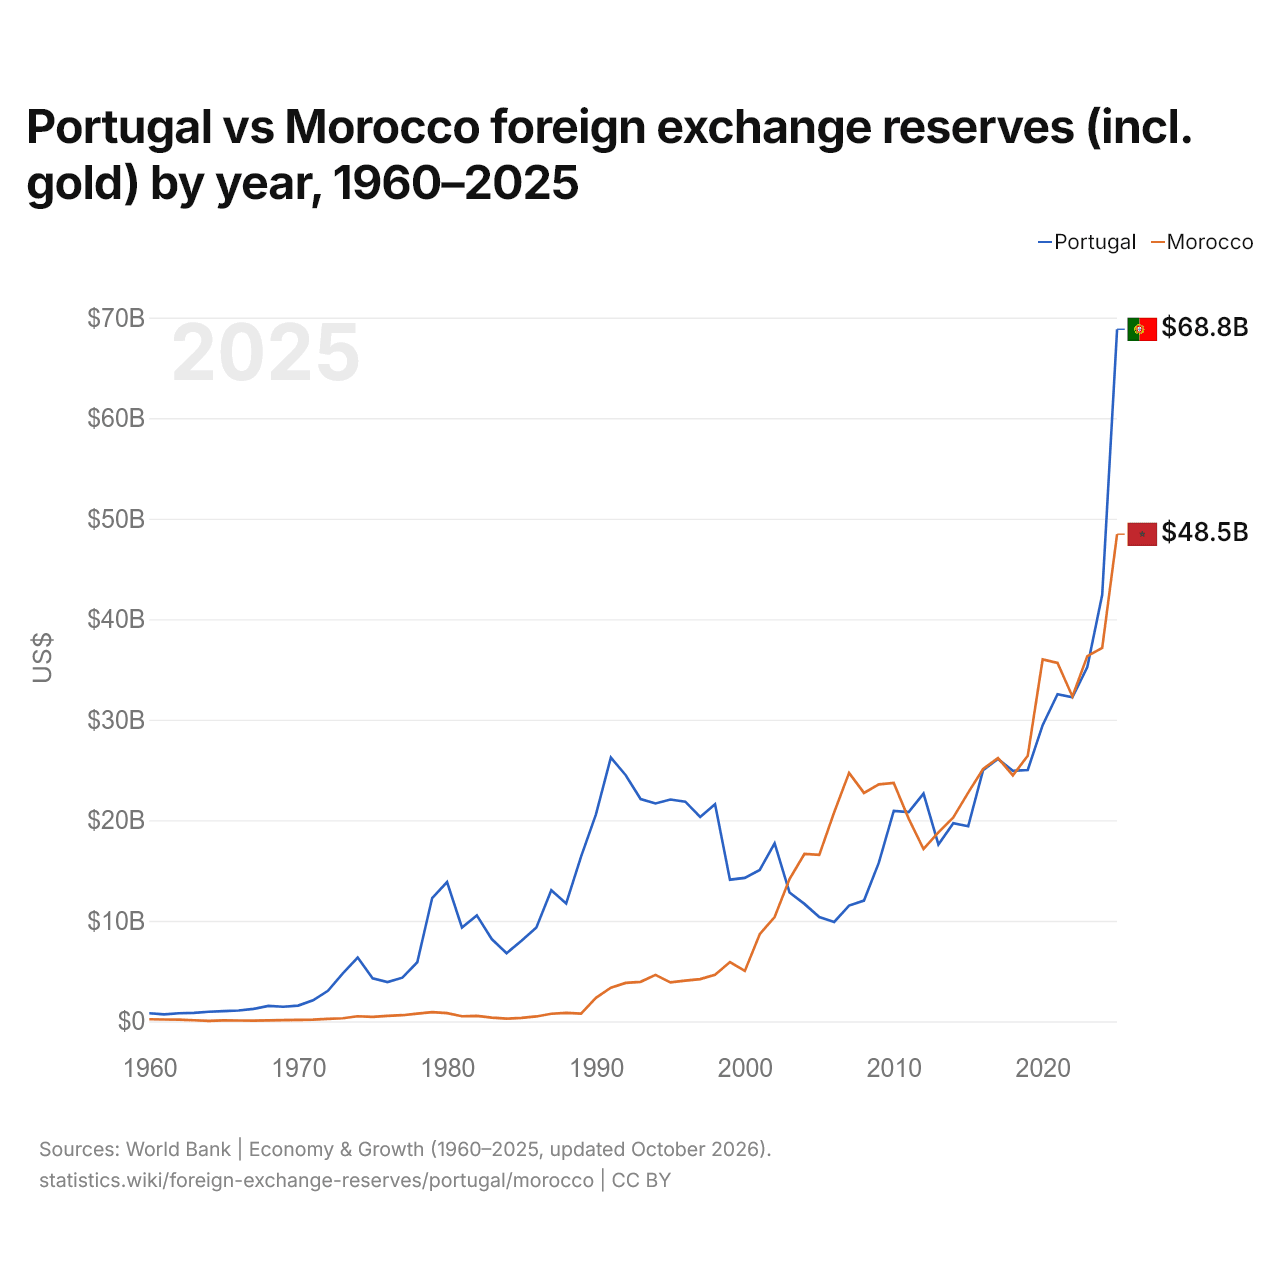
Portugal vs Marruecos: reservas de divisas (incluido el oro) por año, 1960–2025
1x
| Año | US$ | |
|---|---|---|
 Portugal |
 Marruecos |
|
| 2025 | 68.839.157.118 US$ | 48.453.629.605 US$ |
| 2024 | 42.434.283.511 US$ | 37.133.907.723 US$ |
| 2023 | 35.242.560.648 US$ | 36.327.701.788 US$ |
| 2022 | 32.231.572.059 US$ | 32.314.245.660 US$ |
| 2021 | 32.535.115.418 US$ | 35.648.269.520 US$ |
| 2020 | 29.459.811.843 US$ | 35.997.639.773 US$ |
| 2019 | 25.002.862.228 US$ | 26.412.762.237 US$ |
| 2018 | 24.920.338.987 US$ | 24.461.023.093 US$ |
| 2017 | 26.096.701.287 US$ | 26.189.585.939 US$ |
| 2016 | 24.989.773.865 US$ | 25.096.263.444 US$ |
| 2015 | 19.402.623.792 US$ | 22.749.566.244 US$ |
| 2014 | 19.700.737.012 US$ | 20.272.045.639 US$ |
| 2013 | 17.589.253.885 US$ | 18.797.794.940 US$ |
| 2012 | 22.658.232.426 US$ | 17.138.210.439 US$ |
| 2011 | 20.801.304.307 US$ | 20.167.412.692 US$ |
| 2010 | 20.936.757.462 US$ | 23.709.466.594 US$ |
| 2009 | 15.781.930.171 US$ | 23.568.387.093 US$ |
| 2008 | 12.006.451.709 US$ | 22.719.558.204 US$ |
| 2007 | 11.512.068.377 US$ | 24.713.570.214 US$ |
| 2006 | 9.882.747.256 US$ | 20.790.794.061 US$ |
| 2005 | 10.364.170.168 US$ | 16.550.639.874 US$ |
| 2004 | 11.684.065.091 US$ | 16.646.737.349 US$ |
| 2003 | 12.813.462.308 US$ | 14.146.568.781 US$ |
| 2002 | 17.700.956.382 US$ | 10.375.315.952 US$ |
| 2001 | 15.060.281.506 US$ | 8.669.348.377 US$ |
| 2000 | 14.262.113.157 US$ | 5.016.934.755 US$ |
| 1999 | 14.088.450.971 US$ | 5.893.811.631 US$ |
| 1998 | 21.606.105.341 US$ | 4.637.702.510 US$ |
| 1997 | 20.322.803.841 US$ | 4.197.122.871 US$ |
| 1996 | 21.850.466.132 US$ | 4.054.079.031 US$ |
| 1995 | 22.063.365.760 US$ | 3.873.508.557 US$ |
| 1994 | 21.670.533.105 US$ | 4.621.504.414 US$ |
| 1993 | 22.115.180.395 US$ | 3.929.934.565 US$ |
| 1992 | 24.481.230.706 US$ | 3.818.642.196 US$ |
| 1991 | 26.239.358.014 US$ | 3.349.097.140 US$ |
| 1990 | 20.578.947.935 US$ | 2.337.533.790 US$ |
| 1989 | 16.388.652.067 US$ | 770.803.382 US$ |
| 1988 | 11.719.331.742 US$ | 836.286.994 US$ |
| 1987 | 13.039.014.495 US$ | 751.948.890 US$ |
| 1986 | 9.336.202.502 US$ | 486.544.572 US$ |
| 1985 | 8.008.241.510 US$ | 345.295.873 US$ |
| 1984 | 6.773.536.263 US$ | 265.729.347 US$ |
| 1983 | 8.180.649.541 US$ | 375.256.521 US$ |
| 1982 | 10.540.549.467 US$ | 539.242.247 US$ |
| 1981 | 9.334.151.674 US$ | 509.516.095 US$ |
| 1980 | 13.862.932.271 US$ | 813.620.198 US$ |
| 1979 | 12.262.027.703 US$ | 917.484.622 US$ |
| 1978 | 5.873.321.282 US$ | 772.082.199 US$ |
| 1977 | 4.342.230.245 US$ | 609.585.604 US$ |
| 1976 | 3.904.791.954 US$ | 549.011.048 US$ |
| 1975 | 4.285.387.933 US$ | 437.657.147 US$ |
| 1974 | 6.353.120.252 US$ | 504.349.099 US$ |
| 1973 | 4.767.686.793 US$ | 307.947.925 US$ |
| 1972 | 3.034.003.805 US$ | 252.590.996 US$ |
| 1971 | 2.092.684.248 US$ | 176.838.008 US$ |
| 1970 | 1.564.794.900 US$ | 141.722.000 US$ |
| 1969 | 1.449.770.000 US$ | 114.120.000 US$ |
| 1968 | 1.531.644.000 US$ | 89.140.000 US$ |
| 1967 | 1.237.714.000 US$ | 75.720.000 US$ |
| 1966 | 1.080.200.300 US$ | 86.814.000 US$ |
| 1965 | 1.011.085.200 US$ | 98.872.000 US$ |
| 1964 | 955.702.800 US$ | 53.111.520 US$ |
| 1963 | 843.136.000 US$ | 110.211.320 US$ |
| 1962 | 808.042.200 US$ | 174.203.030 US$ |
| 1961 | 693.999.000 US$ | 185.269.350 US$ |
| 1960 | 801.276.000 US$ | 206.112.400 US$ |
En 2025, las reservas de divisas de Portugal fueron de 68,8 mil millones de US$ y las de Marruecos, de 48,5 mil millones de US$: las de Portugal fueron un 42 % mayores. En 1960, las reservas de Portugal fueron 3,9 veces mayores: 801 millones de US$ de Portugal y 206 millones de US$ de Marruecos.
Portugal vs Marruecos: reservas, incluido el oro, y meses de importaciones cubiertos
|
Portugal
|
Marruecos
|
|
|---|---|---|
| Reservas, incluido el oro | 68,8 mil M US$ | 48,5 mil M US$ |
| Meses de importaciones | 5,6 | 6,2 |
| Puesto mundial | 39/168 | 51/168 |
| Diferencia de reservas | 1,4× | 0,7× |
Comparar las reservas de divisas de 2 países cualesquiera
Fuentes:
- Banco Mundial | Economía y crecimiento (1960–2025, actualizado en octubre de 2026)
Creative Commons Atribución (CC BY): puedes copiar, compartir, adaptar y reutilizar este contenido, también con fines comerciales, siempre que cites a statistics.wiki e indiques los cambios que hayas hecho. Las fuentes indicadas arriba pueden tener sus propias condiciones de licencia.