
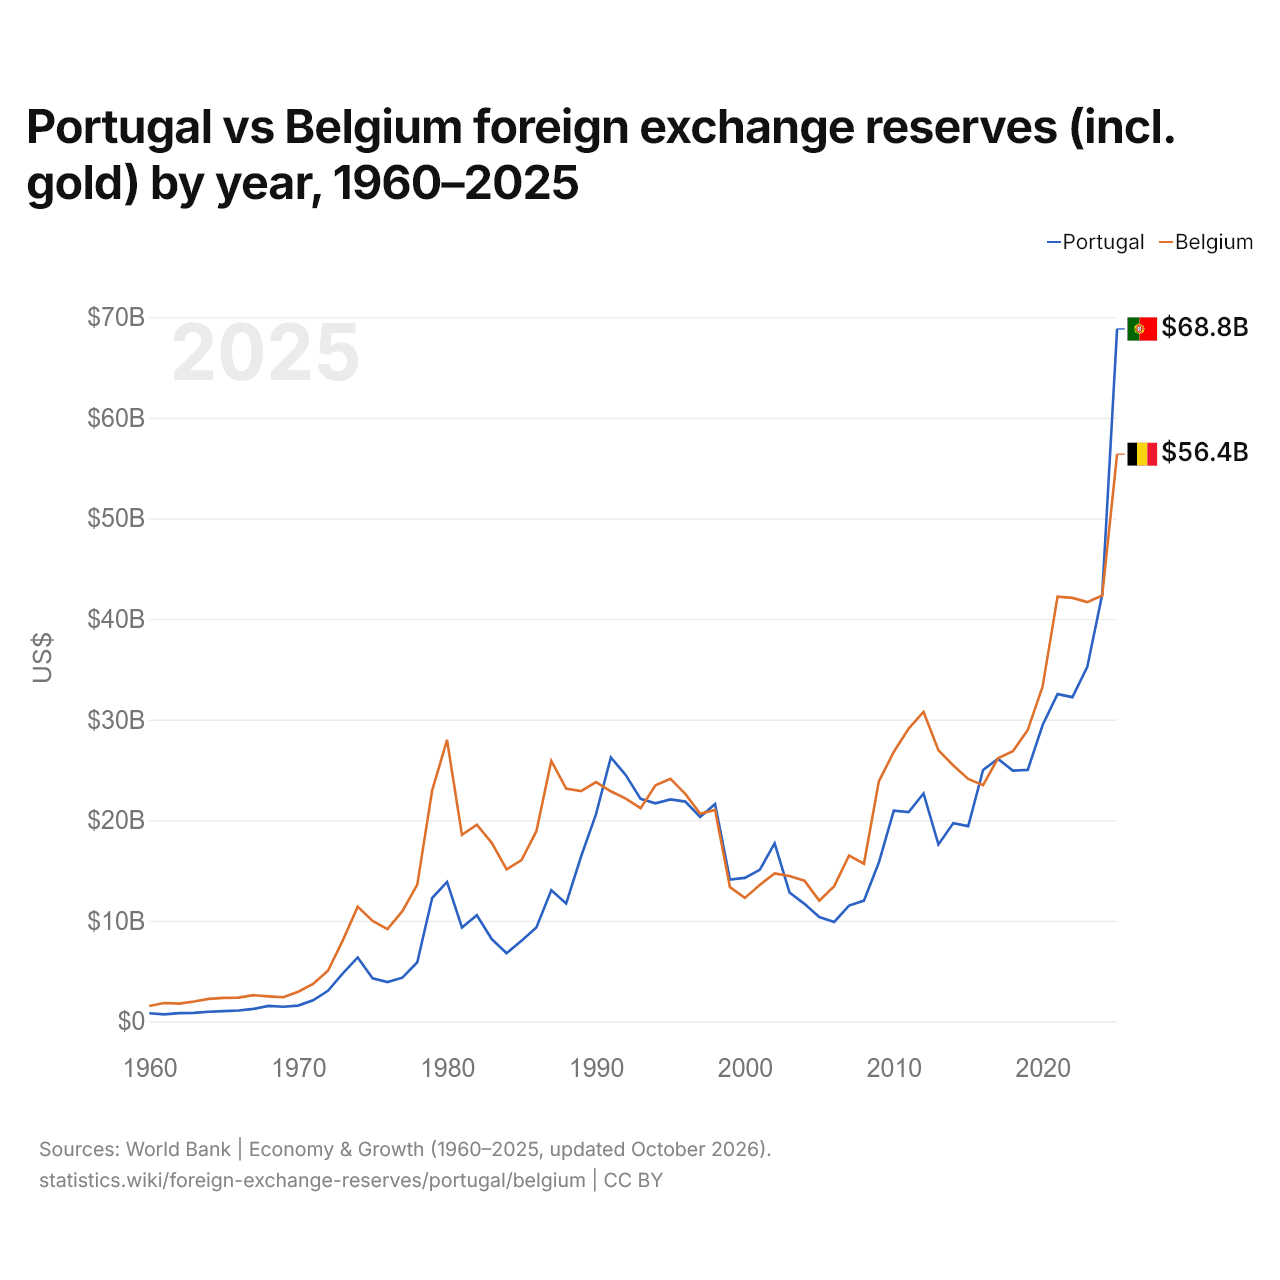
Portugal vs Bélgica: reservas de divisas (incluido el oro) por año, 1960–2025
1x
| Año | US$ | |
|---|---|---|
 Portugal |
 Bélgica |
|
| 2025 | 68.839.157.118 US$ | 56.392.530.499 US$ |
| 2024 | 42.434.283.511 US$ | 42.330.768.016 US$ |
| 2023 | 35.242.560.648 US$ | 41.674.984.631 US$ |
| 2022 | 32.231.572.059 US$ | 42.101.229.345 US$ |
| 2021 | 32.535.115.418 US$ | 42.216.681.553 US$ |
| 2020 | 29.459.811.843 US$ | 33.296.227.565 US$ |
| 2019 | 25.002.862.228 US$ | 28.969.986.952 US$ |
| 2018 | 24.920.338.987 US$ | 26.856.799.009 US$ |
| 2017 | 26.096.701.287 US$ | 26.151.437.584 US$ |
| 2016 | 24.989.773.865 US$ | 23.480.922.147 US$ |
| 2015 | 19.402.623.792 US$ | 24.101.851.039 US$ |
| 2014 | 19.700.737.012 US$ | 25.444.391.273 US$ |
| 2013 | 17.589.253.885 US$ | 26.946.175.032 US$ |
| 2012 | 22.658.232.426 US$ | 30.768.939.404 US$ |
| 2011 | 20.801.304.307 US$ | 29.114.266.148 US$ |
| 2010 | 20.936.757.462 US$ | 26.779.063.929 US$ |
| 2009 | 15.781.930.171 US$ | 23.861.674.313 US$ |
| 2008 | 12.006.451.709 US$ | 15.680.647.981 US$ |
| 2007 | 11.512.068.377 US$ | 16.485.311.239 US$ |
| 2006 | 9.882.747.256 US$ | 13.436.681.104 US$ |
| 2005 | 10.364.170.168 US$ | 11.996.383.513 US$ |
| 2004 | 11.684.065.091 US$ | 13.990.812.128 US$ |
| 2003 | 12.813.462.308 US$ | 14.448.826.871 US$ |
| 2002 | 17.700.956.382 US$ | 14.697.923.742 US$ |
| 2001 | 15.060.281.506 US$ | 13.560.301.157 US$ |
| 2000 | 14.262.113.157 US$ | 12.271.745.172 US$ |
| 1999 | 14.088.450.971 US$ | 13.346.240.662 US$ |
| 1998 | 21.606.105.341 US$ | 21.012.750.278 US$ |
| 1997 | 20.322.803.841 US$ | 20.635.950.073 US$ |
| 1996 | 21.850.466.132 US$ | 22.609.776.070 US$ |
| 1995 | 22.063.365.760 US$ | 24.120.463.000 US$ |
| 1994 | 21.670.533.105 US$ | 23.474.024.354 US$ |
| 1993 | 22.115.180.395 US$ | 21.197.694.512 US$ |
| 1992 | 24.481.230.706 US$ | 22.146.931.621 US$ |
| 1991 | 26.239.358.014 US$ | 22.868.663.721 US$ |
| 1990 | 20.578.947.935 US$ | 23.788.895.634 US$ |
| 1989 | 16.388.652.067 US$ | 22.886.849.283 US$ |
| 1988 | 11.719.331.742 US$ | 23.145.049.666 US$ |
| 1987 | 13.039.014.495 US$ | 25.898.989.384 US$ |
| 1986 | 9.336.202.502 US$ | 18.899.783.761 US$ |
| 1985 | 8.008.241.510 US$ | 16.026.466.437 US$ |
| 1984 | 6.773.536.263 US$ | 15.102.823.617 US$ |
| 1983 | 8.180.649.541 US$ | 17.754.310.163 US$ |
| 1982 | 10.540.549.467 US$ | 19.545.394.588 US$ |
| 1981 | 9.334.151.674 US$ | 18.539.741.074 US$ |
| 1980 | 13.862.932.271 US$ | 27.973.532.283 US$ |
| 1979 | 12.262.027.703 US$ | 22.959.057.237 US$ |
| 1978 | 5.873.321.282 US$ | 13.591.056.963 US$ |
| 1977 | 4.342.230.245 US$ | 10.958.484.439 US$ |
| 1976 | 3.904.791.954 US$ | 9.173.446.261 US$ |
| 1975 | 4.285.387.933 US$ | 9.983.533.481 US$ |
| 1974 | 6.353.120.252 US$ | 11.403.306.217 US$ |
| 1973 | 4.767.686.793 US$ | 8.052.357.419 US$ |
| 1972 | 3.034.003.805 US$ | 5.028.350.688 US$ |
| 1971 | 2.092.684.248 US$ | 3.721.848.719 US$ |
| 1970 | 1.564.794.900 US$ | 2.946.532.105 US$ |
| 1969 | 1.449.770.000 US$ | 2.395.121.264 US$ |
| 1968 | 1.531.644.000 US$ | 2.486.675.902 US$ |
| 1967 | 1.237.714.000 US$ | 2.597.706.014 US$ |
| 1966 | 1.080.200.300 US$ | 2.357.973.398 US$ |
| 1965 | 1.011.085.200 US$ | 2.339.311.318 US$ |
| 1964 | 955.702.800 US$ | 2.227.003.947 US$ |
| 1963 | 843.136.000 US$ | 1.973.351.171 US$ |
| 1962 | 808.042.200 US$ | 1.756.067.570 US$ |
| 1961 | 693.999.000 US$ | 1.819.222.318 US$ |
| 1960 | 801.276.000 US$ | 1.526.945.821 US$ |
En 2025, las reservas de divisas de Portugal fueron de 68,8 mil millones de US$ y las de Bélgica, de 56,4 mil millones de US$: las de Portugal fueron un 22 % mayores. En 1960, las reservas de Bélgica fueron 1,9 veces mayores: 801 millones de US$ de Portugal y 1,53 mil millones de US$ de Bélgica.
Portugal vs Bélgica: reservas, incluido el oro, y meses de importaciones cubiertos
|
Portugal
|
Bélgica
|
|
|---|---|---|
| Reservas, incluido el oro | 68,8 mil M US$ | 56,4 mil M US$ |
| Meses de importaciones | 5,6 | 1,2 |
| Puesto mundial | 39/168 | 45/168 |
| Diferencia de reservas | 1,2× | 0,82× |
Comparar las reservas de divisas de 2 países cualesquiera
Fuentes:
- Banco Mundial | Economía y crecimiento (1960–2025, actualizado en octubre de 2026)
Creative Commons Atribución (CC BY): puedes copiar, compartir, adaptar y reutilizar este contenido, también con fines comerciales, siempre que cites a statistics.wiki e indiques los cambios que hayas hecho. Las fuentes indicadas arriba pueden tener sus propias condiciones de licencia.