
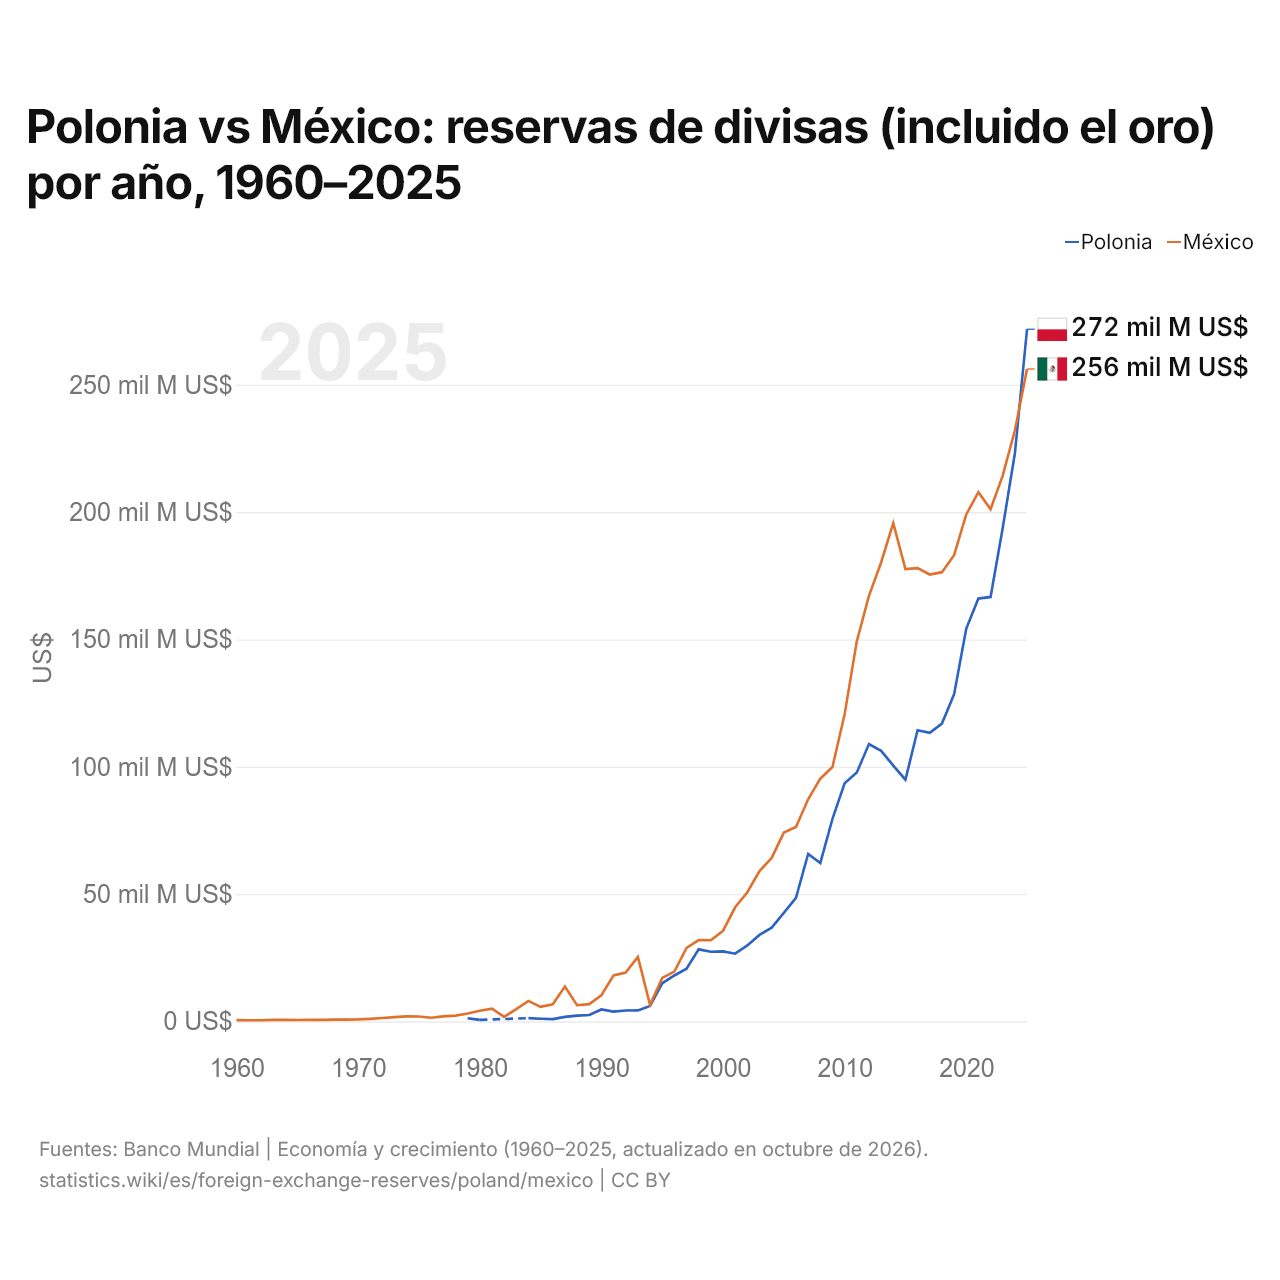
Polonia vs México: reservas de divisas (incluido el oro) por año, 1960–2025
1x
| Año | US$ | |
|---|---|---|
 Polonia |
 México |
|
| 2025 | 271.805.173.253 US$ | 256.178.680.249 US$ |
| 2024 | 223.114.909.804 US$ | 232.035.392.465 US$ |
| 2023 | 193.783.277.723 US$ | 214.316.827.085 US$ |
| 2022 | 166.663.927.036 US$ | 201.118.689.946 US$ |
| 2021 | 166.030.186.476 US$ | 207.799.490.381 US$ |
| 2020 | 154.219.192.491 US$ | 199.069.188.921 US$ |
| 2019 | 128.392.157.887 US$ | 183.056.094.118 US$ |
| 2018 | 116.956.636.328 US$ | 176.390.278.596 US$ |
| 2017 | 113.267.368.075 US$ | 175.469.669.184 US$ |
| 2016 | 114.328.539.233 US$ | 177.973.637.255 US$ |
| 2015 | 94.902.630.299 US$ | 177.596.632.553 US$ |
| 2014 | 100.452.420.334 US$ | 195.681.624.546 US$ |
| 2013 | 106.221.491.036 US$ | 180.200.033.350 US$ |
| 2012 | 108.902.203.544 US$ | 167.075.785.316 US$ |
| 2011 | 97.712.435.349 US$ | 149.208.113.907 US$ |
| 2010 | 93.472.504.101 US$ | 120.584.016.515 US$ |
| 2009 | 79.521.599.626 US$ | 99.888.815.494 US$ |
| 2008 | 62.183.606.684 US$ | 95.299.838.183 US$ |
| 2007 | 65.724.834.525 US$ | 87.208.175.923 US$ |
| 2006 | 48.473.948.179 US$ | 76.329.367.204 US$ |
| 2005 | 42.560.656.301 US$ | 74.109.703.346 US$ |
| 2004 | 36.772.763.413 US$ | 64.201.699.863 US$ |
| 2003 | 33.958.963.963 US$ | 59.026.700.311 US$ |
| 2002 | 29.783.862.625 US$ | 50.671.452.145 US$ |
| 2001 | 26.563.086.840 US$ | 44.804.667.773 US$ |
| 2000 | 27.469.379.417 US$ | 35.577.279.054 US$ |
| 1999 | 27.314.254.943 US$ | 31.828.401.325 US$ |
| 1998 | 28.276.350.178 US$ | 31.863.181.980 US$ |
| 1997 | 20.669.498.321 US$ | 28.852.477.361 US$ |
| 1996 | 18.018.685.658 US$ | 19.526.913.036 US$ |
| 1995 | 14.957.023.987 US$ | 17.045.558.633 US$ |
| 1994 | 6.023.061.698 US$ | 6.441.390.536 US$ |
| 1993 | 4.276.726.019 US$ | 25.298.703.698 US$ |
| 1992 | 4.256.740.152 US$ | 19.171.357.434 US$ |
| 1991 | 3.799.891.432 US$ | 18.052.066.982 US$ |
| 1990 | 4.673.859.368 US$ | 10.216.845.194 US$ |
| 1989 | 2.503.603.416 US$ | 6.740.245.011 US$ |
| 1988 | 2.248.959.113 US$ | 6.326.668.370 US$ |
| 1987 | 1.723.208.693 US$ | 13.691.985.454 US$ |
| 1986 | 882.302.656 US$ | 6.673.540.003 US$ |
| 1985 | 1.024.744.000 US$ | 5.678.880.167 US$ |
| 1984 | 1.251.517.600 US$ | 8.018.704.803 US$ |
| 1983 | - | 4.793.446.679 US$ |
| 1982 | - | 1.777.613.442 US$ |
| 1981 | - | 4.971.260.746 US$ |
| 1980 | 574.441.000 US$ | 4.175.319.837 US$ |
| 1979 | 1.223.020.000 US$ | 3.087.692.135 US$ |
| 1978 | - | 2.269.381.533 US$ |
| 1977 | - | 1.938.338.555 US$ |
| 1976 | - | 1.403.804.527 US$ |
| 1975 | - | 1.896.784.593 US$ |
| 1974 | - | 1.920.866.300 US$ |
| 1973 | - | 1.679.817.085 US$ |
| 1972 | - | 1.296.684.257 US$ |
| 1971 | - | 981.458.345 US$ |
| 1970 | - | 756.033.730 US$ |
| 1969 | - | 663.370.800 US$ |
| 1968 | - | 689.436.600 US$ |
| 1967 | - | 586.953.600 US$ |
| 1966 | - | 564.571.660 US$ |
| 1965 | - | 538.031.680 US$ |
| 1964 | - | 587.594.480 US$ |
| 1963 | - | 548.302.680 US$ |
| 1962 | - | 427.198.020 US$ |
| 1961 | - | 413.480.000 US$ |
| 1960 | - | 444.341.600 US$ |
En 2025, las reservas de divisas de Polonia fueron de 272 mil millones de US$ y las de México, de 256 mil millones de US$: las de Polonia fueron un 6,1 % mayores. En 1979, las reservas de México fueron 2,5 veces mayores: 1,22 mil millones de US$ de Polonia y 3,09 mil millones de US$ de México.
Polonia vs México: reservas, incluido el oro, y meses de importaciones cubiertos
|
Polonia
|
México
|
|
|---|---|---|
| Reservas, incluido el oro | 272 mil M US$ | 256 mil M US$ |
| Meses de importaciones | 6,7 | 4,2 |
| Puesto mundial | 16/168 | 17/168 |
| Diferencia de reservas | 1,1× | 0,94× |
Comparar las reservas de divisas de 2 países cualesquiera
Fuentes:
- Banco Mundial | Economía y crecimiento (1960–2025, actualizado en octubre de 2026)
Creative Commons Atribución (CC BY): puedes copiar, compartir, adaptar y reutilizar este contenido, también con fines comerciales, siempre que cites a statistics.wiki e indiques los cambios que hayas hecho. Las fuentes indicadas arriba pueden tener sus propias condiciones de licencia.