
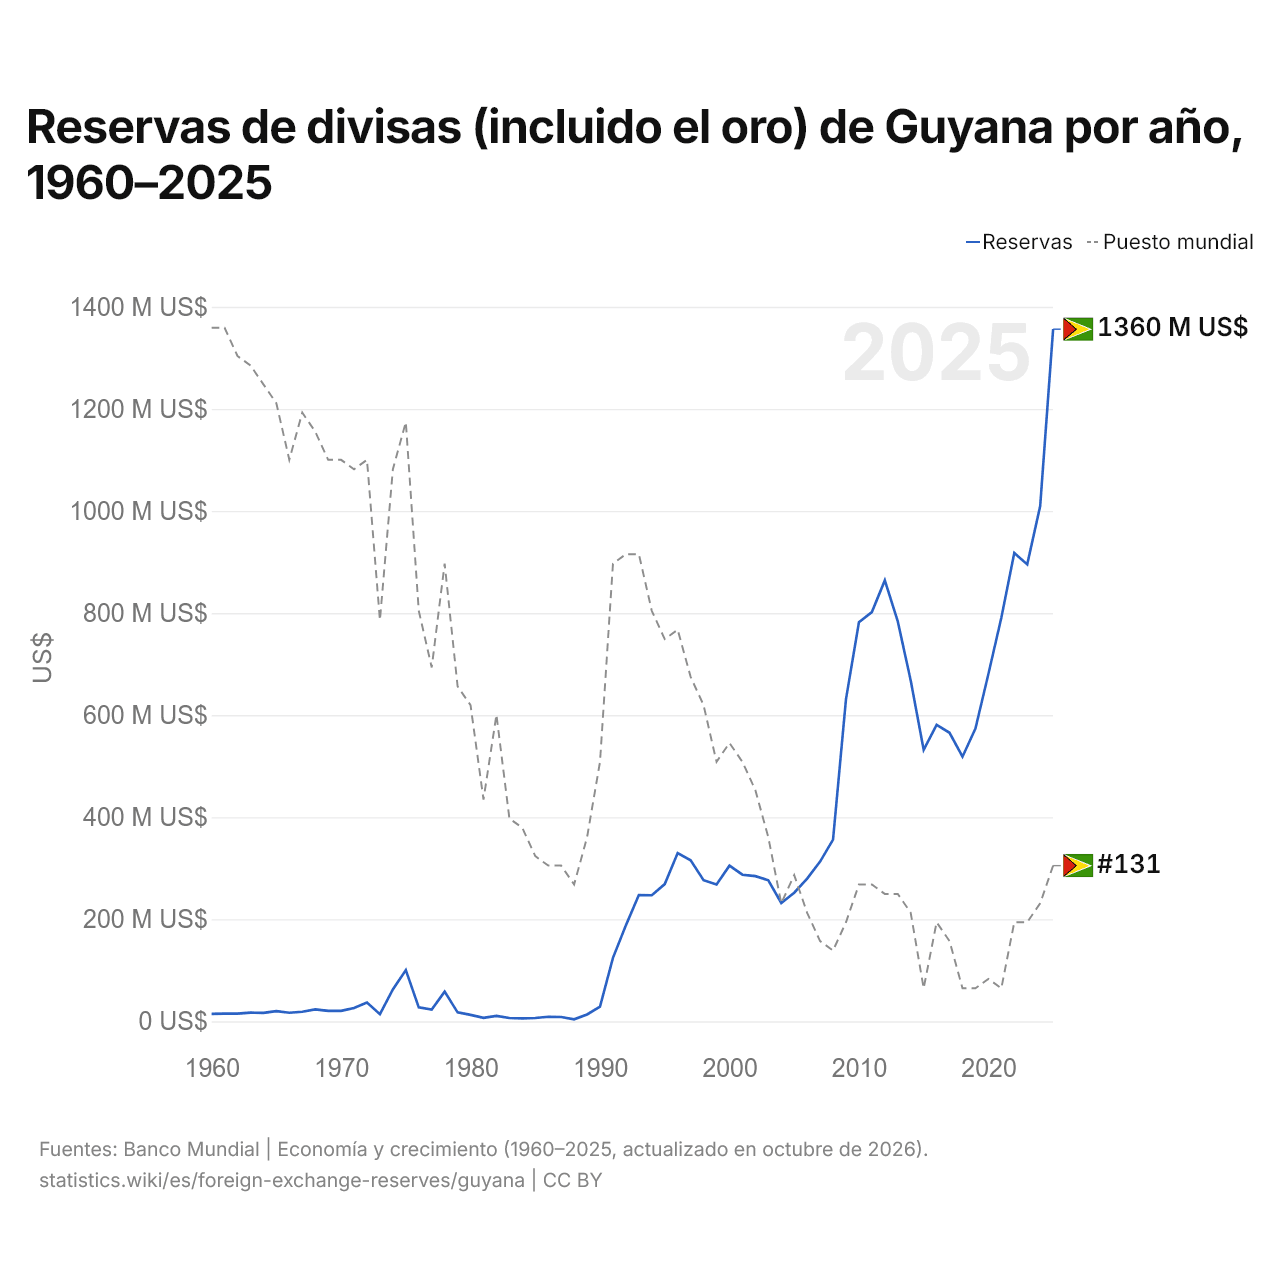
Reservas de divisas (incluido el oro) de Guyana por año, 1960–2025
1x
| Año | US$ | Puesto mundial |
|---|---|---|
| Reservas | ||
| 2025 | 1.356.212.379 US$ | #131 |
| 2024 | 1.009.772.164 US$ | #135 |
| 2023 | 895.275.181 US$ | #137 |
| 2022 | 917.877.051 US$ | #137 |
| 2021 | 790.784.502 US$ | #144 |
| 2020 | 680.634.184 US$ | #143 |
| 2019 | 573.446.281 US$ | #144 |
| 2018 | 518.509.369 US$ | #144 |
| 2017 | 565.363.504 US$ | #139 |
| 2016 | 580.981.473 US$ | #137 |
| 2015 | 531.887.028 US$ | #144 |
| 2014 | 667.925.089 US$ | #136 |
| 2013 | 783.621.041 US$ | #134 |
| 2012 | 864.028.135 US$ | #134 |
| 2011 | 801.777.696 US$ | #133 |
| 2010 | 782.063.530 US$ | #133 |
| 2009 | 631.410.305 US$ | #137 |
| 2008 | 355.913.640 US$ | #140 |
| 2007 | 313.007.749 US$ | #139 |
| 2006 | 279.636.391 US$ | #136 |
| 2005 | 251.872.586 US$ | #132 |
| 2004 | 231.844.788 US$ | #135 |
| 2003 | 276.387.312 US$ | #128 |
| 2002 | 284.472.829 US$ | #123 |
| 2001 | 287.255.329 US$ | #120 |
| 2000 | 304.956.641 US$ | #118 |
| 1999 | 268.276.096 US$ | #120 |
| 1998 | 276.599.939 US$ | #114 |
| 1997 | 315.505.363 US$ | #111 |
| 1996 | 329.676.784 US$ | #106 |
| 1995 | 268.938.847 US$ | #107 |
| 1994 | 247.126.598 US$ | #104 |
| 1993 | 247.450.000 US$ | #98 |
| 1992 | 188.080.001 US$ | #98 |
| 1991 | 124.416.127 US$ | #99 |
| 1990 | 28.679.759 US$ | #120 |
| 1989 | 13.350.000 US$ | #128 |
| 1988 | 4.040.000 US$ | #133 |
| 1987 | 8.430.000 US$ | #131 |
| 1986 | 9.000.000 US$ | #131 |
| 1985 | 6.470.000 US$ | #130 |
| 1984 | 5.850.000 US$ | #127 |
| 1983 | 6.490.000 US$ | #126 |
| 1982 | 10.557.048 US$ | #115 |
| 1981 | 6.910.513 US$ | #124 |
| 1980 | 12.700.000 US$ | #114 |
| 1979 | 17.528.050 US$ | #112 |
| 1978 | 58.265.716 US$ | #99 |
| 1977 | 22.976.165 US$ | #110 |
| 1976 | 27.282.884 US$ | #104 |
| 1975 | 100.496.676 US$ | #84 |
| 1974 | 62.572.064 US$ | #89 |
| 1973 | 13.973.635 US$ | #105 |
| 1972 | 36.750.300 US$ | #88 |
| 1971 | 26.156.007 US$ | #89 |
| 1970 | 20.400.000 US$ | #88 |
| 1969 | 20.550.000 US$ | #88 |
| 1968 | 23.550.000 US$ | #85 |
| 1967 | 18.850.000 US$ | #83 |
| 1966 | 16.900.000 US$ | #88 |
| 1965 | 20.120.000 US$ | #82 |
| 1964 | 16.550.000 US$ | #80 |
| 1963 | 16.900.000 US$ | #78 |
| 1962 | 15.090.000 US$ | #77 |
| 1961 | 15.090.000 US$ | #74 |
| 1960 | 14.740.000 US$ | #74 |
En 2025, las reservas de divisas de Guyana fueron de 1,36 mil millones de US$, frente a 14,7 millones de US$ en 1960. Su mínimo fue de 4,04 millones de US$, en 1988. Ocuparon el puesto 131 del mundo; en 2024, el 135. Su mejor posición fue el puesto 74, por última vez en 1961.
En 2025, las reservas de divisas de Guyana ocuparon el 23.º puesto entre 32 países de América Latina.
Guyana en la clasificación mundial de reservas de divisas (incluido el oro), 2025
| Puesto | País | Reservas | Meses de importaciones | |
|---|---|---|---|---|
| 128 |
 Surinam |
1620 M US$ | 3,5 | vs Surinam |
| 129 |
 Chad |
1550 M US$ (2024) | 5,5 (2024) | |
| 130 |
 Malta |
1540 M US$ | 0,7 | |
| 131 |
 Guyana |
1360 M US$ | 1,0 (2023) | |
| 132 |
 Guinea |
1350 M US$ (2024) | 1,1 (2024) | |
| 133 |
 Cabo Verde |
1260 M US$ | 9,3 | |
| 134 |
 Yemen |
1250 M US$ (2022) | 3,5 (2018) |
Comparar las reservas de divisas de Guyana con otros países
Fuentes:
- Banco Mundial | Economía y crecimiento (1960–2025, actualizado en octubre de 2026)
Creative Commons Atribución (CC BY): puedes copiar, compartir, adaptar y reutilizar este contenido, también con fines comerciales, siempre que cites a statistics.wiki e indiques los cambios que hayas hecho. Las fuentes indicadas arriba pueden tener sus propias condiciones de licencia.