
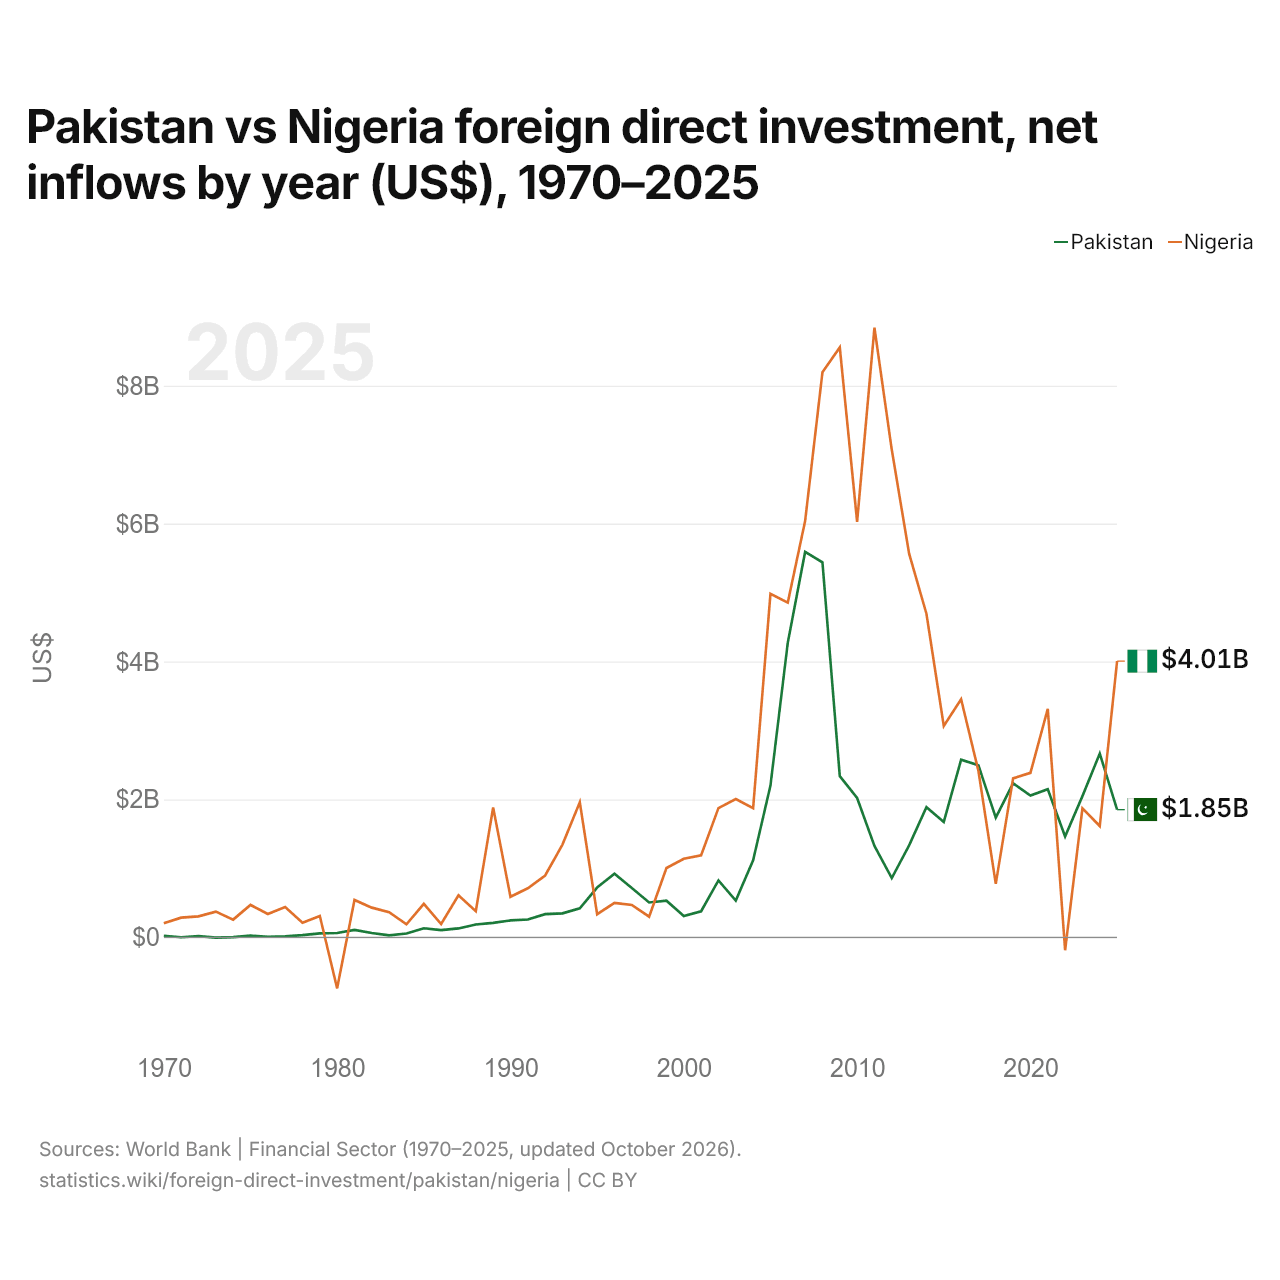
Pakistán vs Nigeria: inversión extranjera directa, entradas netas por año (US$), 1970–2025
| Año | US$ | |
|---|---|---|
 Pakistán |
 Nigeria |
|
| 2025 | 1.852.000.000 US$ | 4.005.360.387 US$ |
| 2024 | 2.665.000.000 US$ | 1.614.032.957 US$ |
| 2023 | 2.048.000.000 US$ | 1.872.520.530 US$ |
| 2022 | 1.462.000.000 US$ | −186.792.429 US$ |
| 2021 | 2.147.000.000 US$ | 3.313.210.000 US$ |
| 2020 | 2.057.000.000 US$ | 2.385.277.666 US$ |
| 2019 | 2.234.000.000 US$ | 2.305.099.812 US$ |
| 2018 | 1.737.000.000 US$ | 775.247.400 US$ |
| 2017 | 2.496.000.000 US$ | 2.412.974.916 US$ |
| 2016 | 2.576.000.000 US$ | 3.453.258.408 US$ |
| 2015 | 1.673.000.000 US$ | 3.064.168.904 US$ |
| 2014 | 1.887.000.000 US$ | 4.693.828.632 US$ |
| 2013 | 1.333.000.000 US$ | 5.562.857.987 US$ |
| 2012 | 859.000.000 US$ | 7.069.908.428 US$ |
| 2011 | 1.326.000.000 US$ | 8.841.062.051 US$ |
| 2010 | 2.022.000.000 US$ | 6.026.253.091 US$ |
| 2009 | 2.338.000.000 US$ | 8.555.990.007 US$ |
| 2008 | 5.438.000.000 US$ | 8.194.071.895 US$ |
| 2007 | 5.590.000.000 US$ | 6.036.021.405 US$ |
| 2006 | 4.273.000.000 US$ | 4.854.353.979 US$ |
| 2005 | 2.201.000.000 US$ | 4.982.533.930 US$ |
| 2004 | 1.118.000.000 US$ | 1.874.060.887 US$ |
| 2003 | 534.000.000 US$ | 2.005.353.563 US$ |
| 2002 | 826.000.000 US$ | 1.874.070.753 US$ |
| 2001 | 378.000.000 US$ | 1.190.618.644 US$ |
| 2000 | 308.000.000 US$ | 1.140.167.556 US$ |
| 1999 | 532.000.000 US$ | 1.004.915.631 US$ |
| 1998 | 506.000.000 US$ | 299.566.658 US$ |
| 1997 | 716.253.125 US$ | 469.577.020 US$ |
| 1996 | 921.976.183 US$ | 499.276.809 US$ |
| 1995 | 722.631.561 US$ | 335.842.165 US$ |
| 1994 | 421.024.638 US$ | 1.959.219.858 US$ |
| 1993 | 348.556.958 US$ | 1.345.368.587 US$ |
| 1992 | 336.479.857 US$ | 896.641.282 US$ |
| 1991 | 258.414.487 US$ | 712.373.362 US$ |
| 1990 | 245.262.963 US$ | 587.882.971 US$ |
| 1989 | 210.599.917 US$ | 1.884.249.739 US$ |
| 1988 | 186.491.557 US$ | 378.667.098 US$ |
| 1987 | 129.377.644 US$ | 610.552.091 US$ |
| 1986 | 105.730.332 US$ | 193.214.908 US$ |
| 1985 | 131.389.252 US$ | 485.581.321 US$ |
| 1984 | 55.510.170 US$ | 189.164.785 US$ |
| 1983 | 29.457.027 US$ | 364.434.580 US$ |
| 1982 | 63.833.092 US$ | 430.611.256 US$ |
| 1981 | 108.084.749 US$ | 542.327.289 US$ |
| 1980 | 63.632.993 US$ | −738.870.004 US$ |
| 1979 | 58.254.127 US$ | 309.598.869 US$ |
| 1978 | 32.273.193 US$ | 210.933.271 US$ |
| 1977 | 15.223.204 US$ | 440.514.242 US$ |
| 1976 | 8.220.530 US$ | 339.000.000 US$ |
| 1975 | 25.000.000 US$ | 470.120.000 US$ |
| 1974 | 4.000.000 US$ | 257.000.000 US$ |
| 1973 | −4.000.000 US$ | 373.000.000 US$ |
| 1972 | 17.000.000 US$ | 305.000.000 US$ |
| 1971 | 1.000.000 US$ | 286.000.000 US$ |
| 1970 | 23.000.000 US$ | 205.000.000 US$ |
En 2025, las entradas netas de inversión extranjera directa fueron de 1,85 mil millones de US$ en Pakistán y de 4,01 mil millones de US$ en Nigeria: 2,2 veces más en Nigeria. En 1970, fueron de 23 millones de US$ en Pakistán y de 205 millones de US$ en Nigeria.
Las entradas netas de inversión extranjera directa en Pakistán fueron mayores que en Nigeria en 10 de los 56 años de 1970 a 2025, y menores en 46.
Pakistán vs Nigeria: últimas entradas y salidas de inversión extranjera
|
Pakistán
|
Nigeria
|
|
|---|---|---|
| Entradas netas | +1850 M US$ | +4010 M US$ |
| Entradas netas, % del PIB | +0,5 % | +1,4 % |
| Salidas netas | +267 M US$ | +1190 M US$ |
| Entradas netas, total 2016–2025 | +21,3 mil M US$ | +22,0 mil M US$ |
| Puesto mundial | 70/192 | 51/192 |
Comparar la inversión extranjera directa de 2 países cualesquiera
Fuentes:
- Banco Mundial | Sector financiero (1970–2025, actualizado en octubre de 2026)
Creative Commons Atribución (CC BY): puedes copiar, compartir, adaptar y reutilizar este contenido, también con fines comerciales, siempre que cites a statistics.wiki e indiques los cambios que hayas hecho. Las fuentes indicadas arriba pueden tener sus propias condiciones de licencia.