
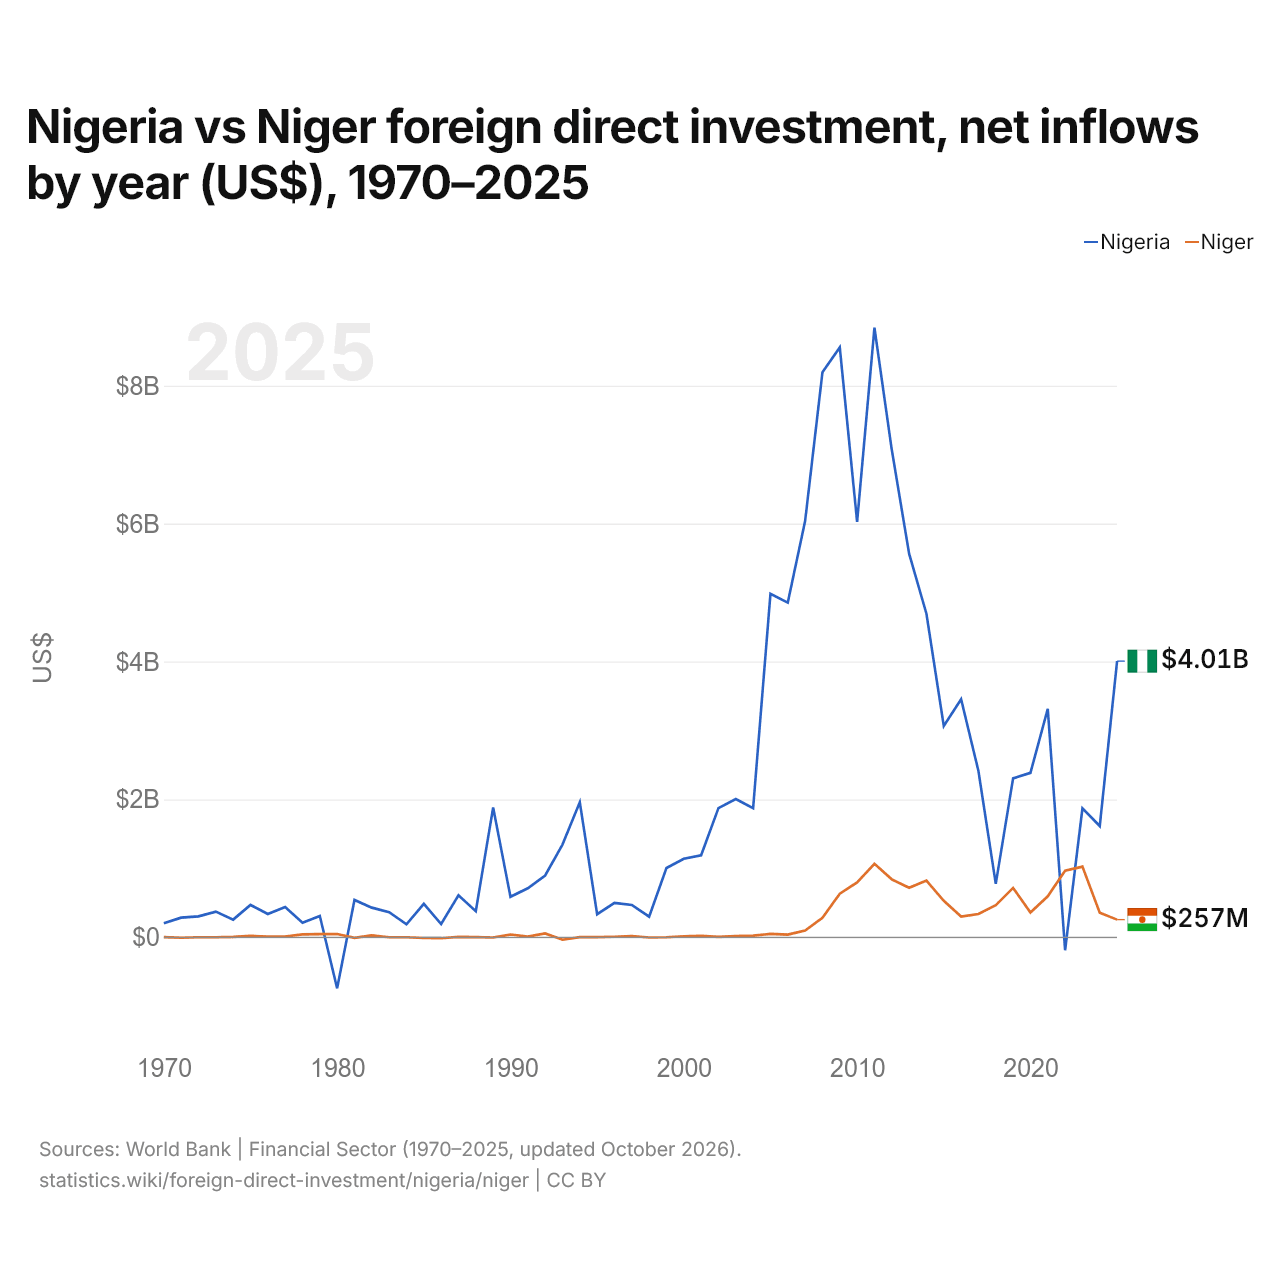
Nigeria vs Níger: inversión extranjera directa, entradas netas por año (US$), 1970–2025
| Año | US$ | |
|---|---|---|
 Nigeria |
 Níger |
|
| 2025 | 4.005.360.387 US$ | 257.053.405 US$ |
| 2024 | 1.614.032.957 US$ | 358.083.456 US$ |
| 2023 | 1.872.520.530 US$ | 1.025.552.444 US$ |
| 2022 | −186.792.429 US$ | 965.975.261 US$ |
| 2021 | 3.313.210.000 US$ | 594.829.132 US$ |
| 2020 | 2.385.277.666 US$ | 360.653.575 US$ |
| 2019 | 2.305.099.812 US$ | 717.147.639 US$ |
| 2018 | 775.247.400 US$ | 466.042.273 US$ |
| 2017 | 2.412.974.916 US$ | 338.710.710 US$ |
| 2016 | 3.453.258.408 US$ | 301.332.481 US$ |
| 2015 | 3.064.168.904 US$ | 529.476.871 US$ |
| 2014 | 4.693.828.632 US$ | 822.967.023 US$ |
| 2013 | 5.562.857.987 US$ | 719.338.470 US$ |
| 2012 | 7.069.908.428 US$ | 841.227.437 US$ |
| 2011 | 8.841.062.051 US$ | 1.067.186.136 US$ |
| 2010 | 6.026.253.091 US$ | 796.636.158 US$ |
| 2009 | 8.555.990.007 US$ | 633.819.197 US$ |
| 2008 | 8.194.071.895 US$ | 283.076.207 US$ |
| 2007 | 6.036.021.405 US$ | 99.073.672 US$ |
| 2006 | 4.854.353.979 US$ | 40.310.044 US$ |
| 2005 | 4.982.533.930 US$ | 49.753.597 US$ |
| 2004 | 1.874.060.887 US$ | 24.411.287 US$ |
| 2003 | 2.005.353.563 US$ | 18.529.139 US$ |
| 2002 | 1.874.070.753 US$ | 7.827.442 US$ |
| 2001 | 1.190.618.644 US$ | 22.587.455 US$ |
| 2000 | 1.140.167.556 US$ | 15.767.212 US$ |
| 1999 | 1.004.915.631 US$ | 1.605.269 US$ |
| 1998 | 299.566.658 US$ | −1.764.551 US$ |
| 1997 | 469.577.020 US$ | 18.959.364 US$ |
| 1996 | 499.276.809 US$ | 8.630.591 US$ |
| 1995 | 335.842.165 US$ | 2.233.805 US$ |
| 1994 | 1.959.219.858 US$ | 4.075.974 US$ |
| 1993 | 1.345.368.587 US$ | −34.157.056 US$ |
| 1992 | 896.641.282 US$ | 56.390.111 US$ |
| 1991 | 712.373.362 US$ | 11.240.420 US$ |
| 1990 | 587.882.971 US$ | 40.809.537 US$ |
| 1989 | 1.884.249.739 US$ | −1.564.223 US$ |
| 1988 | 378.667.098 US$ | 2.155.460 US$ |
| 1987 | 610.552.091 US$ | 6.405.211 US$ |
| 1986 | 193.214.908 US$ | −12.408.105 US$ |
| 1985 | 485.581.321 US$ | −9.382.033 US$ |
| 1984 | 189.164.785 US$ | 1.446.368 US$ |
| 1983 | 364.434.580 US$ | 1.215.013 US$ |
| 1982 | 430.611.256 US$ | 28.216.140 US$ |
| 1981 | 542.327.289 US$ | −6.112.653 US$ |
| 1980 | −738.870.004 US$ | 49.119.755 US$ |
| 1979 | 309.598.869 US$ | 46.788.845 US$ |
| 1978 | 210.933.271 US$ | 42.657.877 US$ |
| 1977 | 440.514.242 US$ | 12.850.065 US$ |
| 1976 | 339.000.000 US$ | 9.889.078 US$ |
| 1975 | 470.120.000 US$ | 22.555.805 US$ |
| 1974 | 257.000.000 US$ | 6.908.881 US$ |
| 1973 | 373.000.000 US$ | 1.000.000 US$ |
| 1972 | 305.000.000 US$ | 900.000 US$ |
| 1971 | 286.000.000 US$ | −5.300.000 US$ |
| 1970 | 205.000.000 US$ | 2.720.000 US$ |
En 2025, las entradas netas de inversión extranjera directa fueron de 4,01 mil millones de US$ en Nigeria y de 257 millones de US$ en Níger: 16 veces más en Nigeria. En 1970, fueron de 205 millones de US$ en Nigeria y de 2,72 millones de US$ en Níger.
Las entradas netas de inversión extranjera directa en Nigeria fueron mayores que en Níger en 54 de los 56 años de 1970 a 2025, y menores en 2.
Nigeria vs Níger: últimas entradas y salidas de inversión extranjera
|
Nigeria
|
Níger
|
|
|---|---|---|
| Entradas netas | +4010 M US$ | +257 M US$ |
| Entradas netas, % del PIB | +1,4 % | +1,2 % |
| Salidas netas | +1190 M US$ | +6,51 M US$ |
| Entradas netas, total 2016–2025 | +22,0 mil M US$ | +5390 M US$ |
| Puesto mundial | 51/192 | 133/192 |
Comparar la inversión extranjera directa de 2 países cualesquiera
Fuentes:
- Banco Mundial | Sector financiero (1970–2025, actualizado en octubre de 2026)
Creative Commons Atribución (CC BY): puedes copiar, compartir, adaptar y reutilizar este contenido, también con fines comerciales, siempre que cites a statistics.wiki e indiques los cambios que hayas hecho. Las fuentes indicadas arriba pueden tener sus propias condiciones de licencia.