
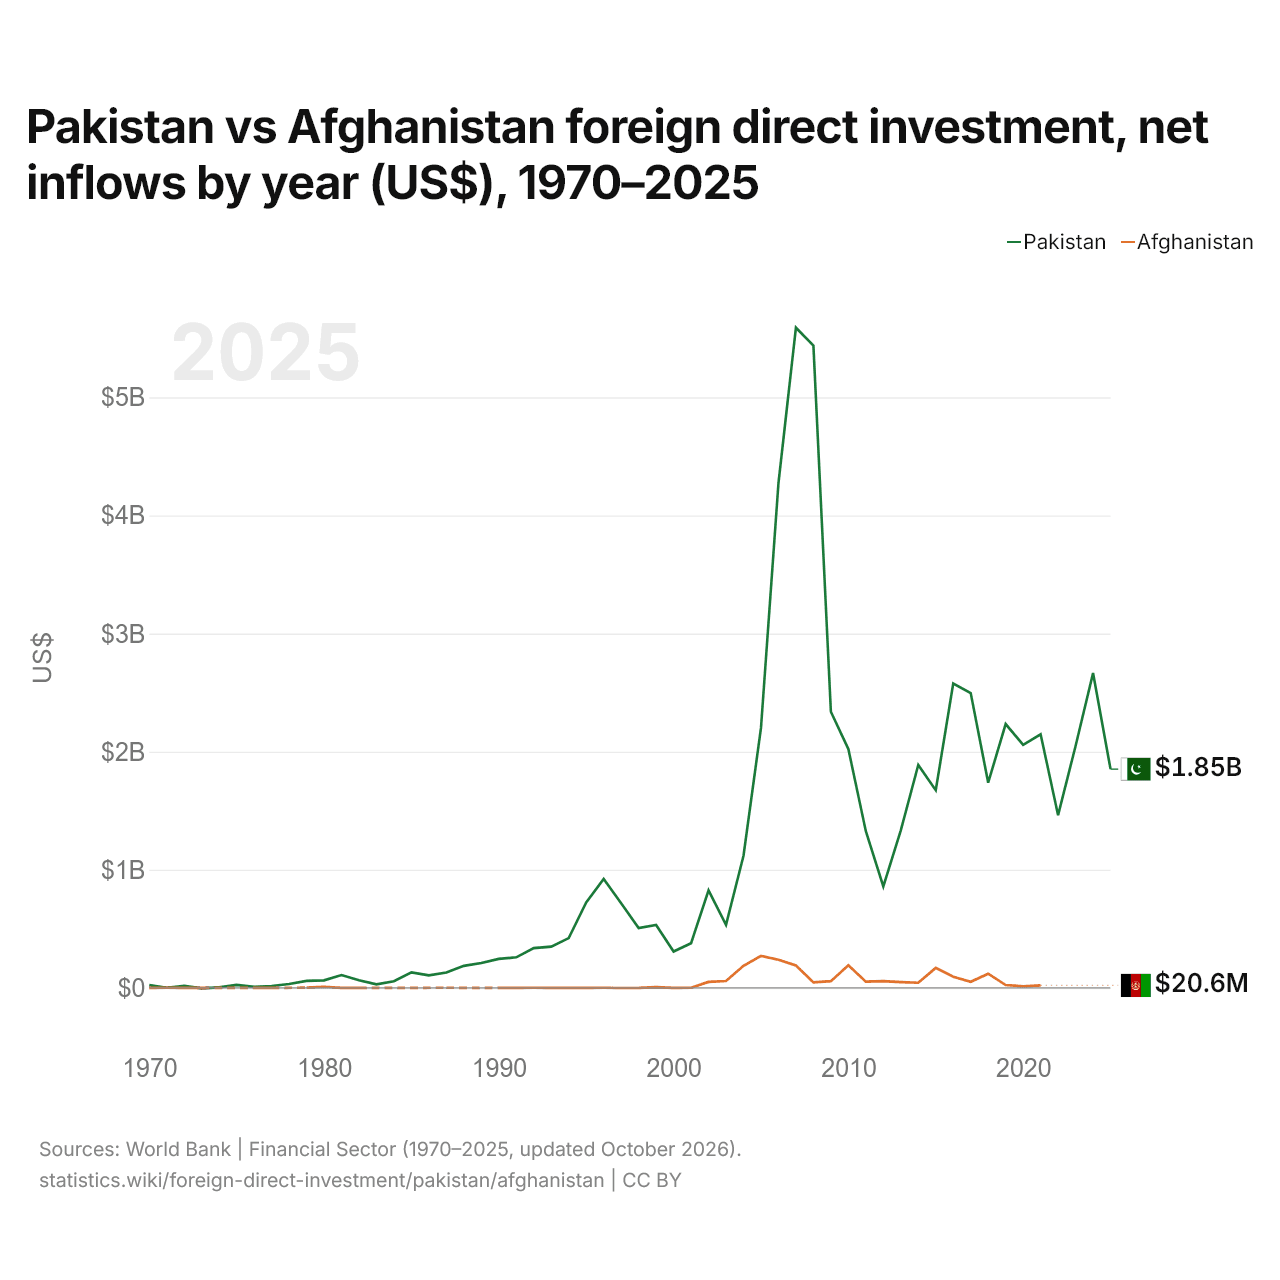
Pakistán vs Afganistán: inversión extranjera directa, entradas netas por año (US$), 1970–2025
1x
| Año | US$ | |
|---|---|---|
 Pakistán |
 Afganistán |
|
| 2025 | 1.852.000.000 US$ | - |
| 2024 | 2.665.000.000 US$ | - |
| 2023 | 2.048.000.000 US$ | - |
| 2022 | 1.462.000.000 US$ | - |
| 2021 | 2.147.000.000 US$ | 20.600.976 US$ |
| 2020 | 2.057.000.000 US$ | 12.970.148 US$ |
| 2019 | 2.234.000.000 US$ | 23.404.554 US$ |
| 2018 | 1.737.000.000 US$ | 119.435.106 US$ |
| 2017 | 2.496.000.000 US$ | 51.533.897 US$ |
| 2016 | 2.576.000.000 US$ | 93.591.315 US$ |
| 2015 | 1.673.000.000 US$ | 169.146.608 US$ |
| 2014 | 1.887.000.000 US$ | 42.975.263 US$ |
| 2013 | 1.333.000.000 US$ | 48.311.346 US$ |
| 2012 | 859.000.000 US$ | 56.823.660 US$ |
| 2011 | 1.326.000.000 US$ | 52.173.421 US$ |
| 2010 | 2.022.000.000 US$ | 190.774.432 US$ |
| 2009 | 2.338.000.000 US$ | 56.107.247 US$ |
| 2008 | 5.438.000.000 US$ | 46.033.740 US$ |
| 2007 | 5.590.000.000 US$ | 188.690.000 US$ |
| 2006 | 4.273.000.000 US$ | 238.000.000 US$ |
| 2005 | 2.201.000.000 US$ | 271.000.000 US$ |
| 2004 | 1.118.000.000 US$ | 186.900.000 US$ |
| 2003 | 534.000.000 US$ | 57.800.000 US$ |
| 2002 | 826.000.000 US$ | 50.000.000 US$ |
| 2001 | 378.000.000 US$ | 680.000 US$ |
| 2000 | 308.000.000 US$ | 170.000 US$ |
| 1999 | 532.000.000 US$ | 6.040.000 US$ |
| 1998 | 506.000.000 US$ | −10.000 US$ |
| 1997 | 716.253.125 US$ | −1.460.000 US$ |
| 1996 | 921.976.183 US$ | 690.000 US$ |
| 1995 | 722.631.561 US$ | −93.327 US$ |
| 1994 | 421.024.638 US$ | 20.000 US$ |
| 1993 | 348.556.958 US$ | −20.000 US$ |
| 1992 | 336.479.857 US$ | 360.000 US$ |
| 1991 | 258.414.487 US$ | −280.000 US$ |
| 1990 | 245.262.963 US$ | 10 US$ |
| 1989 | 210.599.917 US$ | - |
| 1988 | 186.491.557 US$ | - |
| 1987 | 129.377.644 US$ | 400.000 US$ |
| 1986 | 105.730.332 US$ | - |
| 1985 | 131.389.252 US$ | - |
| 1984 | 55.510.170 US$ | - |
| 1983 | 29.457.027 US$ | - |
| 1982 | 63.833.092 US$ | 100.000 US$ |
| 1981 | 108.084.749 US$ | 180.000 US$ |
| 1980 | 63.632.993 US$ | 9.000.000 US$ |
| 1979 | 58.254.127 US$ | 1.200.000 US$ |
| 1978 | 32.273.193 US$ | - |
| 1977 | 15.223.204 US$ | −240.000 US$ |
| 1976 | 8.220.530 US$ | 40.000 US$ |
| 1975 | 25.000.000 US$ | - |
| 1974 | 4.000.000 US$ | - |
| 1973 | −4.000.000 US$ | 270.000 US$ |
| 1972 | 17.000.000 US$ | 150.000 US$ |
| 1971 | 1.000.000 US$ | 450.000 US$ |
| 1970 | 23.000.000 US$ | 230.000 US$ |
Las entradas netas de inversión extranjera directa en Pakistán son de 1,85 mil millones de US$ (2025), y las en Afganistán, de 20,6 millones de US$ (2021).
Las entradas netas de inversión extranjera directa en Pakistán han sido mayores que en Afganistán en 42 de los 43 años desde 1970 que ambos países comunicaron, y menores en uno.
Pakistán vs Afganistán: últimas entradas y salidas de inversión extranjera
|
Pakistán
|
Afganistán
|
|
|---|---|---|
| Entradas netas | +1850 M US$ (2025) | +20,6 M US$ (2021) |
| Entradas netas, % del PIB | +0,5 % (2025) | +0,1 % (2021) |
| Salidas netas | +267 M US$ (2025) | +30,8 M US$ (2021) |
| Entradas netas, total 2012–2021 | +19,0 mil M US$ | +639 M US$ |
| Puesto mundial | 70/192 | 163/192 |
Comparar la inversión extranjera directa de 2 países cualesquiera
Fuentes:
- Banco Mundial | Sector financiero (1970–2025, actualizado en octubre de 2026)
Creative Commons Atribución (CC BY): puedes copiar, compartir, adaptar y reutilizar este contenido, también con fines comerciales, siempre que cites a statistics.wiki e indiques los cambios que hayas hecho. Las fuentes indicadas arriba pueden tener sus propias condiciones de licencia.