
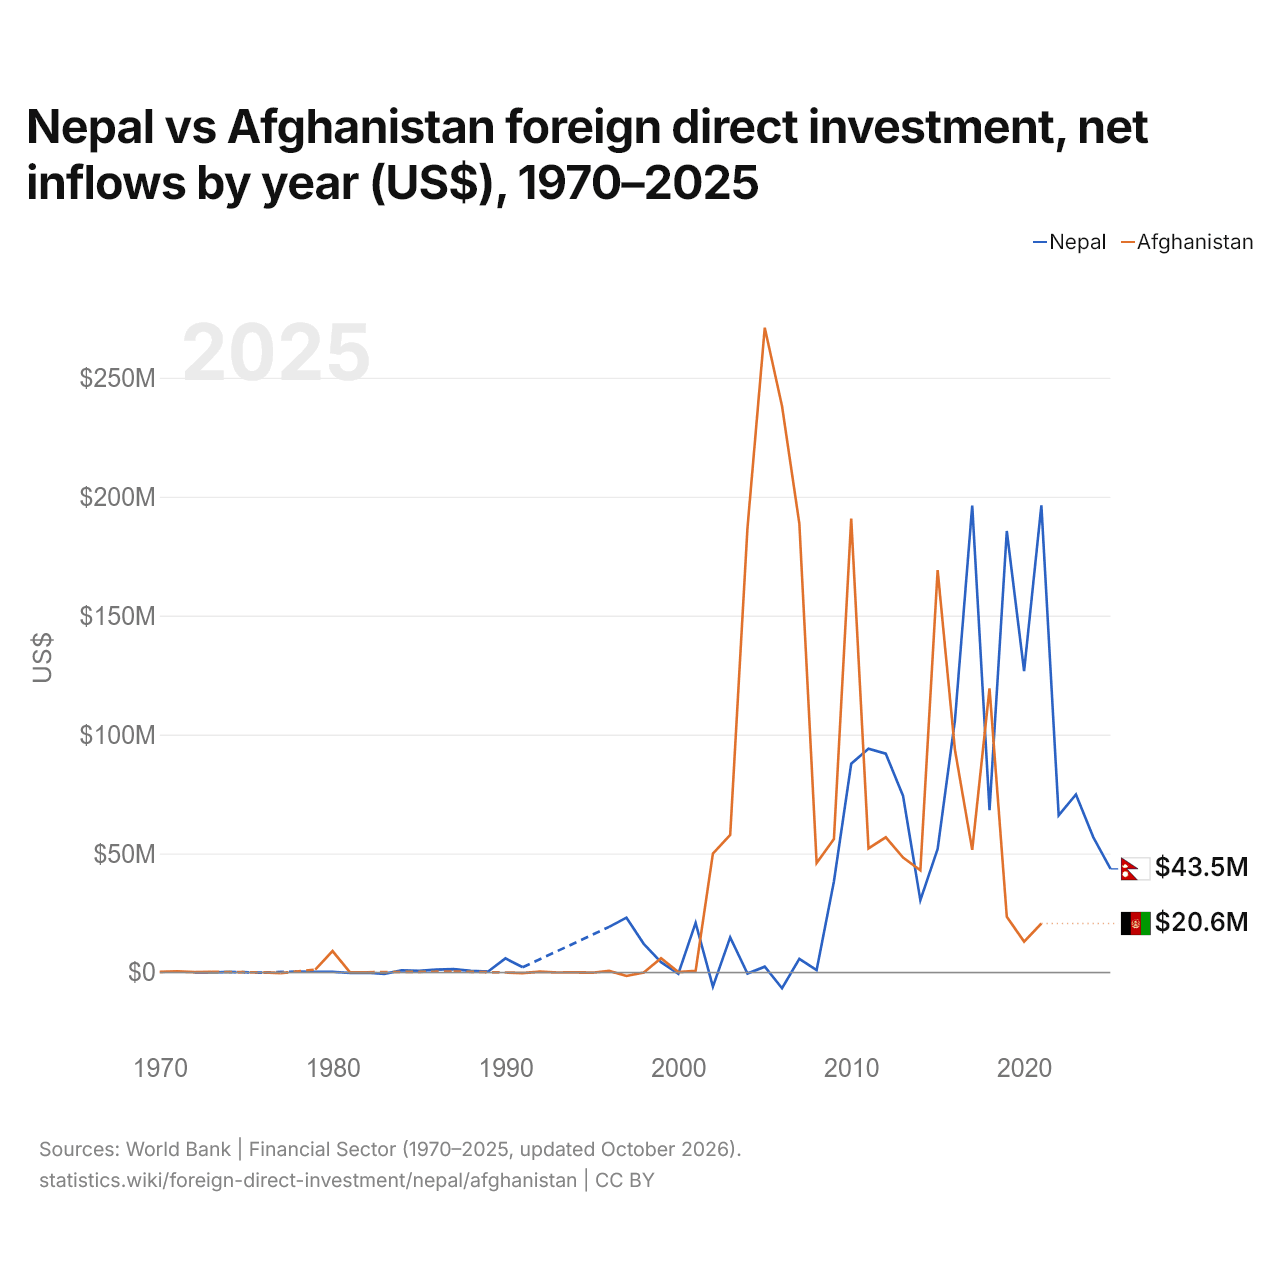
Nepal vs Afganistán: inversión extranjera directa, entradas netas por año (US$), 1970–2025
1x
| Año | US$ | |
|---|---|---|
 Nepal |
 Afganistán |
|
| 2025 | 43.549.530 US$ | - |
| 2024 | 56.900.207 US$ | - |
| 2023 | 74.821.496 US$ | - |
| 2022 | 66.059.661 US$ | - |
| 2021 | 196.326.024 US$ | 20.600.976 US$ |
| 2020 | 126.626.337 US$ | 12.970.148 US$ |
| 2019 | 185.563.266 US$ | 23.404.554 US$ |
| 2018 | 68.261.794 US$ | 119.435.106 US$ |
| 2017 | 196.265.099 US$ | 51.533.897 US$ |
| 2016 | 105.996.376 US$ | 93.591.315 US$ |
| 2015 | 51.895.700 US$ | 169.146.608 US$ |
| 2014 | 30.402.677 US$ | 42.975.263 US$ |
| 2013 | 74.179.633 US$ | 48.311.346 US$ |
| 2012 | 91.954.196 US$ | 56.823.660 US$ |
| 2011 | 94.022.157 US$ | 52.173.421 US$ |
| 2010 | 87.741.712 US$ | 190.774.432 US$ |
| 2009 | 38.271.270 US$ | 56.107.247 US$ |
| 2008 | 995.124 US$ | 46.033.740 US$ |
| 2007 | 5.741.706 US$ | 188.690.000 US$ |
| 2006 | −6.647.984 US$ | 238.000.000 US$ |
| 2005 | 2.451.785 US$ | 271.000.000 US$ |
| 2004 | −417.346 US$ | 186.900.000 US$ |
| 2003 | 14.778.086 US$ | 57.800.000 US$ |
| 2002 | −5.952.541 US$ | 50.000.000 US$ |
| 2001 | 20.850.000 US$ | 680.000 US$ |
| 2000 | −484.827 US$ | 170.000 US$ |
| 1999 | 4.351.069 US$ | 6.040.000 US$ |
| 1998 | 12.024.660 US$ | −10.000 US$ |
| 1997 | 23.056.468 US$ | −1.460.000 US$ |
| 1996 | 19.160.171 US$ | 690.000 US$ |
| 1995 | - | −93.327 US$ |
| 1994 | - | 20.000 US$ |
| 1993 | - | −20.000 US$ |
| 1992 | - | 360.000 US$ |
| 1991 | 2.220.000 US$ | −280.000 US$ |
| 1990 | 5.940.000 US$ | 10 US$ |
| 1989 | 420.000 US$ | - |
| 1988 | 680.000 US$ | - |
| 1987 | 1.390.000 US$ | 400.000 US$ |
| 1986 | 1.170.000 US$ | - |
| 1985 | 650.000 US$ | - |
| 1984 | 950.000 US$ | - |
| 1983 | −600.000 US$ | - |
| 1982 | −30.000 US$ | 100.000 US$ |
| 1981 | −230.000 US$ | 180.000 US$ |
| 1980 | 300.000 US$ | 9.000.000 US$ |
| 1979 | 300.000 US$ | 1.200.000 US$ |
| 1978 | 410.000 US$ | - |
| 1977 | - | −240.000 US$ |
| 1976 | −40.000 US$ | 40.000 US$ |
| 1975 | - | - |
| 1974 | 250.000 US$ | - |
| 1973 | −10.000 US$ | 270.000 US$ |
| 1972 | 30.000 US$ | 150.000 US$ |
| 1971 | - | 450.000 US$ |
| 1970 | - | 230.000 US$ |
Las entradas netas de inversión extranjera directa en Nepal son de 43,5 millones de US$ (2025), y las en Afganistán, de 20,6 millones de US$ (2021).
Las entradas netas de inversión extranjera directa en Nepal han sido mayores que en Afganistán en 15 de los 36 años desde 1972 que ambos países comunicaron, y menores en 21.
Nepal vs Afganistán: últimas entradas y salidas de inversión extranjera
|
Nepal
|
Afganistán
|
|
|---|---|---|
| Entradas netas | +43,5 M US$ (2025) | +20,6 M US$ (2021) |
| Entradas netas, % del PIB | +0,1 % (2025) | +0,1 % (2021) |
| Salidas netas | +17,3 mil US$ (2025) | +30,8 M US$ (2021) |
| Entradas netas, total 2012–2021 | +1130 M US$ | +639 M US$ |
| Puesto mundial | 155/192 | 163/192 |
Comparar la inversión extranjera directa de 2 países cualesquiera
Fuentes:
- Banco Mundial | Sector financiero (1970–2025, actualizado en octubre de 2026)
Creative Commons Atribución (CC BY): puedes copiar, compartir, adaptar y reutilizar este contenido, también con fines comerciales, siempre que cites a statistics.wiki e indiques los cambios que hayas hecho. Las fuentes indicadas arriba pueden tener sus propias condiciones de licencia.