
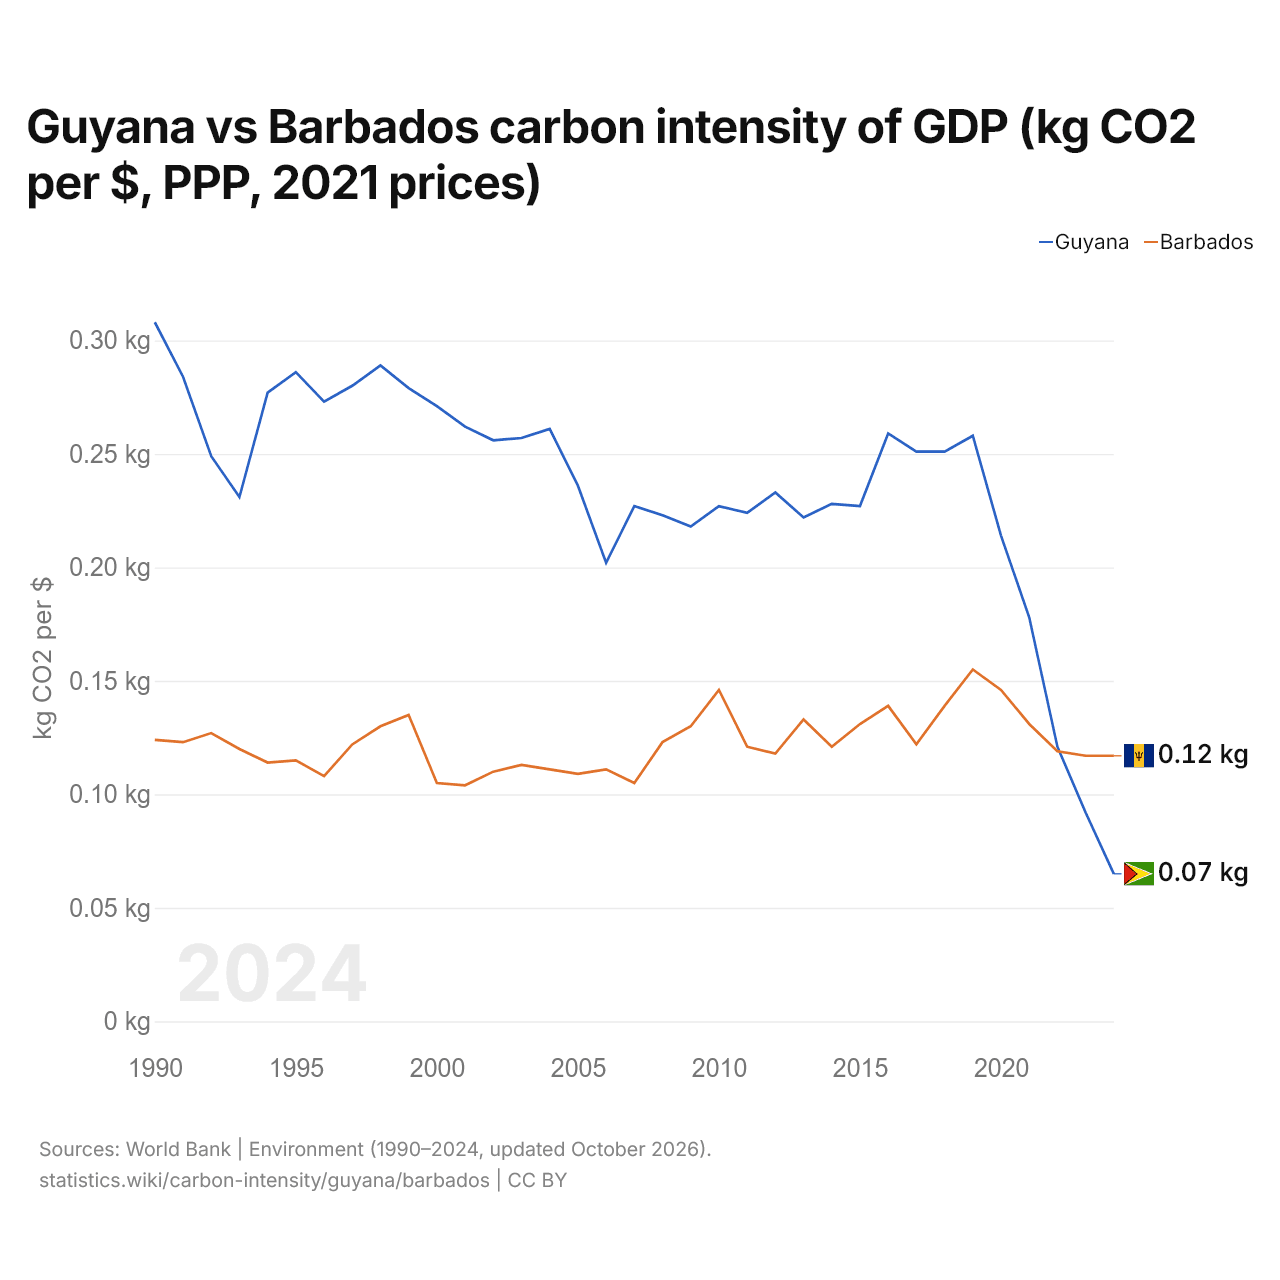
Guyana vs Barbados carbon intensity of GDP (kg CO2 per $, PPP, 2021 prices)
1x
| Year | kg CO2 per $ | |
|---|---|---|
 Guyana |
 Barbados |
|
| 2024 | 0.065 kg | 0.117 kg |
| 2023 | 0.092 kg | 0.117 kg |
| 2022 | 0.121 kg | 0.119 kg |
| 2021 | 0.178 kg | 0.131 kg |
| 2020 | 0.214 kg | 0.146 kg |
| 2019 | 0.258 kg | 0.155 kg |
| 2018 | 0.251 kg | 0.139 kg |
| 2017 | 0.251 kg | 0.122 kg |
| 2016 | 0.259 kg | 0.139 kg |
| 2015 | 0.227 kg | 0.131 kg |
| 2014 | 0.228 kg | 0.121 kg |
| 2013 | 0.222 kg | 0.133 kg |
| 2012 | 0.233 kg | 0.118 kg |
| 2011 | 0.224 kg | 0.121 kg |
| 2010 | 0.227 kg | 0.146 kg |
| 2009 | 0.218 kg | 0.13 kg |
| 2008 | 0.223 kg | 0.123 kg |
| 2007 | 0.227 kg | 0.105 kg |
| 2006 | 0.202 kg | 0.111 kg |
| 2005 | 0.236 kg | 0.109 kg |
| 2004 | 0.261 kg | 0.111 kg |
| 2003 | 0.257 kg | 0.113 kg |
| 2002 | 0.256 kg | 0.11 kg |
| 2001 | 0.262 kg | 0.104 kg |
| 2000 | 0.271 kg | 0.105 kg |
| 1999 | 0.279 kg | 0.135 kg |
| 1998 | 0.289 kg | 0.13 kg |
| 1997 | 0.28 kg | 0.122 kg |
| 1996 | 0.273 kg | 0.108 kg |
| 1995 | 0.286 kg | 0.115 kg |
| 1994 | 0.277 kg | 0.114 kg |
| 1993 | 0.231 kg | 0.12 kg |
| 1992 | 0.249 kg | 0.127 kg |
| 1991 | 0.284 kg | 0.123 kg |
| 1990 | 0.308 kg | 0.124 kg |
Carbon intensity is 0.065 kg of CO2 per dollar of GDP in Guyana and 0.117 kg in Barbados: 0.052 kg more in Barbados. In 1990, Guyana emitted 0.308 kg and Barbados 0.124 kg, a difference of 0.184 kg.
Guyana vs Barbados: latest carbon intensity of GDP
Compare the carbon intensity of GDP of any 2 countries
Sources:
- World Bank | Environment (1990–2024, updated October 2026)
Creative Commons Attribution (CC BY): you may copy, share, adapt and reuse this content, also commercially, as long as you credit statistics.wiki and note any changes you made. The sources listed above may have their own license terms.