
Alcohol consumption per person aged 15+ by country, liters of pure alcohol per year
| Rank | Country | Liters per year | Beers (0.33 l, 5%) a week | Change since 2000, liters |
|---|---|---|---|---|
 World |
4.9 | 5.7 | −0.2 | |
| 1 |  Romania |
16.8 | 19.5 | −2.2 |
| 2 |  Georgia |
14.4 | 16.7 | +3.8 |
| 3 |  Latvia |
12.9 | 15.0 | +4.0 |
| 4 |  Lithuania |
12.1 | 14.1 | +0.6 |
| 5 |  Czech Republic |
12.0 | 13.9 | −2.2 |
| 6 |  Germany |
11.8 | 13.8 | −2.0 |
| 7 |  Poland |
11.7 | 13.6 | +2.0 |
| 8 |  Belarus |
11.6 | 13.5 | −1.0 |
| 9 |  Bulgaria |
11.6 | 13.5 | +0.3 |
| 10 |  Austria |
11.5 | 13.4 | −1.4 |
| 11 |  Uganda |
11.3 | 13.1 | −6.5 |
| 12 |  Burkina Faso |
11.3 | 13.1 | +3.4 |
| 13 |  Moldova |
11.1 | 12.9 | +0.7 |
| 14 |  Tanzania |
11.0 | 12.7 | −0.5 |
| 15 |  Laos |
10.8 | 12.6 | +2.6 |
| 15 |  Luxembourg |
10.8 | 12.6 | −2.8 |
| 17 |  Ireland |
10.8 | 12.5 | −4.3 |
| 18 |  United Kingdom |
10.7 | 12.5 | −1.5 |
| 19 |  Estonia |
10.7 | 12.4 | +0.2 |
| 20 |  Slovakia |
10.7 | 12.4 | −0.4 |
| 21 |  Russia |
10.5 | 12.2 | −3.3 |
| 22 |  Slovenia |
10.4 | 12.1 | −1.7 |
| 23 |  Montenegro |
10.3 (2019) | 12.0 | n/a |
| 24 |  France |
10.3 | 12.0 | −3.4 |
| 25 |  Australia |
10.3 | 12.0 | −0.3 |
| 26 |  Seychelles |
10.2 | 11.8 | +2.8 |
| 27 |  Switzerland |
10.1 | 11.7 | −2.4 |
| 28 |  New Zealand |
10.0 | 11.6 | +0.3 |
| 29 |  Hungary |
9.9 | 11.5 | −2.4 |
| 30 |  United States |
9.9 | 11.5 | +0.9 |
| 31 |  Canada |
9.9 | 11.5 | +0.5 |
| 32 |  Andorra |
9.7 | 11.3 | −2.9 |
| 33 |  Cameroon |
9.6 | 11.2 | −1.1 |
| 34 |  Sweden |
9.6 | 11.1 | +0.2 |
| 35 |  Denmark |
9.5 | 11.0 | −2.2 |
| 36 |  Belgium |
9.4 | 11.0 | −2.0 |
| 37 |  Saint Lucia |
9.3 | 10.8 | −1.1 |
| 38 |  Ukraine |
9.2 | 10.7 | −1.3 |
| 39 |  Spain |
9.2 | 10.6 | −2.5 |
| 40 |  Finland |
9.1 | 10.6 | −0.9 |
| 41 |  Portugal |
8.9 | 10.3 | −3.9 |
| 42 |  Benin |
8.8 | 10.3 | +6.3 |
| 43 |  Netherlands |
8.7 | 10.1 | −2.4 |
| 44 |  Barbados |
8.2 | 9.6 | +1.2 |
| 45 |  Gabon |
8.1 | 9.5 | −1.5 |
| 46 |  Argentina |
8.1 | 9.4 | +1.3 |
| 47 |  Vietnam |
8.0 | 9.3 | +4.8 |
| 48 |  Thailand |
8.0 | 9.3 | −0.6 |
| 49 |  Iceland |
7.9 | 9.2 | +1.0 |
| 50 |  Serbia |
7.9 (2019) | 9.2 | n/a |
| 51 |  South Korea |
7.8 | 9.1 | −3.1 |
| 52 |  Brazil |
7.7 | 8.9 | −1.0 |
| 53 |  Mongolia |
7.7 | 8.9 | +4.9 |
| 54 |  Croatia |
7.7 | 8.9 | −3.3 |
| 55 |  Chile |
7.6 | 8.8 | +1.0 |
| 56 |  Norway |
7.4 | 8.6 | +0.8 |
| 57 |  Grenada |
7.3 | 8.5 | −0.4 |
| 58 |  Botswana |
7.3 | 8.4 | +0.3 |
| 59 |  South Africa |
7.1 | 8.3 | −1.8 |
| 60 |  Malta |
7.1 | 8.3 | +1.4 |
| 61 |  Italy |
7.0 | 8.1 | −3.0 |
| 62 |  Mauritius |
6.9 | 8.0 | −1.1 |
| 63 |  Eswatini |
6.8 | 7.9 | −2.6 |
| 64 |  Cambodia |
6.7 | 7.8 | +4.9 |
| 65 |  Antigua |
6.7 | 7.7 | +1.4 |
| 66 |  Equatorial Guinea |
6.6 | 7.6 | −1.2 |
| 67 |  Dominican Republic |
6.5 | 7.6 | −1.4 |
| 68 |  Peru |
6.5 | 7.5 | +0.4 |
| 69 |  Japan |
6.4 | 7.4 | −1.3 |
| 70 |  Cyprus |
6.4 | 7.4 | −2.5 |
| 71 |  Congo |
6.1 | 7.0 | +3.2 |
| 72 |  Trinidad |
6.0 | 7.0 | +1.0 |
| 73 |  Cape Verde |
6.0 | 7.0 | +1.4 |
| 74 |  Suriname |
5.9 | 6.9 | +1.2 |
| 75 |  Bosnia |
5.9 | 6.8 | +1.0 |
| 76 |  Greece |
5.8 | 6.8 | −2.9 |
| 77 |  Philippines |
5.7 | 6.6 | −0.2 |
| 78 |  Paraguay |
5.6 | 6.5 | −0.1 |
| 78 |  Saint Vincent |
5.6 | 6.5 | +1.0 |
| 80 |  Uruguay |
5.6 | 6.5 | −1.4 |
| 81 |  Cuba |
5.4 | 6.3 | +0.0 |
| 82 |  Mali |
5.3 | 6.2 | +4.5 |
| 83 |  Namibia |
5.1 | 5.9 | +0.4 |
| 84 |  Guyana |
5.0 | 5.9 | −0.3 |
| 85 |  Dominica |
5.0 | 5.8 | −3.1 |
| 86 |  Mexico |
4.8 | 5.6 | −1.4 |
| 86 |  Sao Tome |
4.8 | 5.6 | −1.9 |
| 88 |  Saint Kitts |
4.7 | 5.5 | −1.8 |
| 89 |  Panama |
4.7 | 5.4 | −0.7 |
| 90 |  China |
4.6 | 5.3 | +1.0 |
| 91 |  Kazakhstan |
4.5 | 5.3 | −2.1 |
| 92 |  Albania |
4.5 | 5.2 | +0.0 |
| 93 |  North Macedonia |
4.4 | 5.1 | −0.1 |
| 94 |  Lesotho |
4.3 | 5.0 | +0.5 |
| 95 |  Armenia |
4.3 | 5.0 | +0.6 |
| 96 |  Ghana |
4.3 | 5.0 | −1.1 |
| 97 |  Colombia |
4.2 | 4.9 | −1.1 |
| 98 |  Burundi |
4.2 | 4.8 | −3.3 |
| 99 |  Angola |
4.1 | 4.8 | −1.1 |
| 100 |  India |
4.1 | 4.8 | +2.1 |
| 101 |  North Korea |
3.9 | 4.5 | +0.0 |
| 102 |  Nigeria |
3.8 | 4.4 | −4.1 |
| 103 |  Guinea-Bissau |
3.7 | 4.3 | −0.4 |
| 104 |  Belize |
3.7 | 4.3 | −1.0 |
| 104 |  Nicaragua |
3.7 | 4.3 | −0.3 |
| 106 |  Bahamas |
3.7 | 4.2 | −1.2 |
| 107 |  Kyrgyzstan |
3.6 | 4.2 | −1.9 |
| 108 |  Zambia |
3.6 | 4.2 | +0.1 |
| 109 |  Malawi |
3.6 | 4.2 | +0.6 |
| 110 |  Bolivia |
3.6 | 4.2 | +0.5 |
| 111 |  Fiji |
3.6 | 4.2 | +1.2 |
| 112 |  Costa Rica |
3.4 | 4.0 | −1.2 |
| 113 |  El Salvador |
3.2 | 3.7 | +0.0 |
| 114 |  Haiti |
3.1 | 3.6 | −1.0 |
| 115 |  Jamaica |
3.1 | 3.6 | −0.2 |
| 116 |  Honduras |
3.1 | 3.6 | +0.0 |
| 117 |  Ethiopia |
3.1 | 3.6 | +1.9 |
| 118 |  Chad |
2.9 | 3.4 | +0.4 |
| 118 |  Sri Lanka |
2.9 | 3.4 | +1.0 |
| 120 |  Rwanda |
2.9 | 3.3 | +1.4 |
| 121 |  Liberia |
2.9 | 3.3 | −1.6 |
| 122 |  Ivory Coast |
2.9 | 3.3 | −1.4 |
| 123 |  Israel |
2.8 | 3.3 | −0.1 |
| 124 |  Nauru |
2.8 | 3.2 | −1.7 |
| 125 |  Zimbabwe |
2.7 | 3.1 | −0.4 |
| 126 |  Turkmenistan |
2.6 | 3.0 | +0.0 |
| 127 |  Ecuador |
2.5 | 3.0 | −1.6 |
| 128 |  Azerbaijan |
2.5 | 2.9 | +0.9 |
| 129 |  Kenya |
2.5 | 2.9 | +0.3 |
| 130 |  Samoa |
2.4 | 2.7 | −1.7 |
| 131 |  Uzbekistan |
2.1 | 2.4 | −1.4 |
| 132 |  UAE |
2.1 | 2.4 | +0.3 |
| 133 |  Vanuatu |
2.0 | 2.4 | +0.8 |
| 134 |  Venezuela |
2.0 | 2.3 | −6.2 |
| 135 |  Myanmar |
1.9 | 2.2 | +1.6 |
| 136 |  DR Congo |
1.9 | 2.2 | −6.4 |
| 137 |  Mozambique |
1.9 | 2.2 | +0.8 |
| 138 |  Singapore |
1.8 | 2.1 | −0.5 |
| 139 |  CAR |
1.8 | 2.0 | −0.6 |
| 140 |  Tunisia |
1.7 | 2.0 | +0.1 |
| 141 |  Turkey |
1.7 | 2.0 | −0.8 |
| 142 |  Guatemala |
1.5 | 1.8 | −0.9 |
| 143 |  Maldives |
1.5 | 1.7 | −0.3 |
| 144 |  Solomon Islands |
1.5 | 1.7 | +0.7 |
| 145 |  Togo |
1.4 | 1.7 | −0.1 |
| 146 |  Lebanon |
1.3 | 1.5 | −1.0 |
| 146 |  Tuvalu |
1.3 | 1.5 | −0.5 |
| 148 |  Bahrain |
1.3 | 1.5 | −1.4 |
| 149 |  Papua New Guinea |
1.1 | 1.3 | −1.0 |
| 150 |  Eritrea |
1.1 | 1.2 | +0.1 |
| 151 |  Nepal |
1.1 | 1.2 | +0.9 |
| 152 |  Qatar |
1.1 | 1.2 | +0.1 |
| 153 |  Madagascar |
0.99 | 1.2 | −0.5 |
| 154 |  Malaysia |
0.74 | 0.9 | +0.1 |
| 154 |  Tajikistan |
0.74 | 0.9 | −0.2 |
| 156 |  Kiribati |
0.72 | 0.8 | −0.7 |
| 157 |  Gambia |
0.61 | 0.7 | −3.1 |
| 158 |  Algeria |
0.54 | 0.6 | +0.2 |
| 159 |  Guinea |
0.52 | 0.6 | +0.2 |
| 160 |  Brunei |
0.51 | 0.6 | +0.3 |
| 160 |  Iran |
0.51 | 0.6 | +0.5 |
| 160 |  Oman |
0.51 | 0.6 | −0.3 |
| 163 |  Morocco |
0.50 | 0.6 | +0.0 |
| 164 |  Djibouti |
0.38 | 0.4 | −0.3 |
| 164 |  Senegal |
0.38 | 0.4 | −0.1 |
| 166 |  Tonga |
0.36 | 0.4 | −1.1 |
| 167 |  Sierra Leone |
0.29 | 0.3 | +0.1 |
| 168 |  Iraq |
0.24 | 0.3 | +0.1 |
| 169 |  Comoros |
0.23 | 0.3 | +0.1 |
| 169 |  Jordan |
0.23 | 0.3 | −0.3 |
| 171 |  Bhutan |
0.18 | 0.2 | −3.0 |
| 172 |  East Timor |
0.17 | 0.2 | −0.4 |
| 173 |  Egypt |
0.13 | 0.2 | +0.0 |
| 173 |  Niger |
0.13 | 0.2 | +0.0 |
| 175 |  Bangladesh |
0.09 | 0.1 | +0.1 |
| 175 |  Syria |
0.09 | 0.1 | −1.2 |
| 177 |  Pakistan |
0.08 | 0.1 | +0.1 |
| 178 |  Indonesia |
0.07 | 0.1 | +0.0 |
| 179 |  Yemen |
0.04 | 0.1 | −0.1 |
| 180 |  Libya |
0.01 | 0.0 | +0.0 |
| 181 |  Afghanistan |
0.01 | 0.0 | +0.0 |
| 182 |  Sudan |
0.01 | 0.0 | +0.0 |
| 183 |  Kuwait |
0.00 | 0.0 | +0.0 |
| 183 |  Mauritania |
0.00 | 0.0 | +0.0 |
| 183 |  Saudi Arabia |
0.00 | 0.0 | +0.0 |
| 183 |  Somalia |
0.00 | 0.0 | +0.0 |
The list ranks 186 countries by their latest alcohol consumption, from Romania (16.8 liters of pure alcohol a year per person aged 15+) to Somalia (0.00). The world's average is 4.89 liters, down from 5.11 in 2000. Since 2000, consumption has fallen in 105 countries and risen in 74.
Alcohol consumption here is the WHO's estimate of the pure alcohol that people aged 15 and over drink in a year, per person: the recorded consumption from sales, production and trade plus an estimate of the alcohol that goes unrecorded, such as home-made drinks. A liter of pure alcohol is about 61 bottles of beer of 0.33 liters at 5%; the table also gives the yearly amount as bottles a week.
Alcohol consumption per person aged 15+ by country map
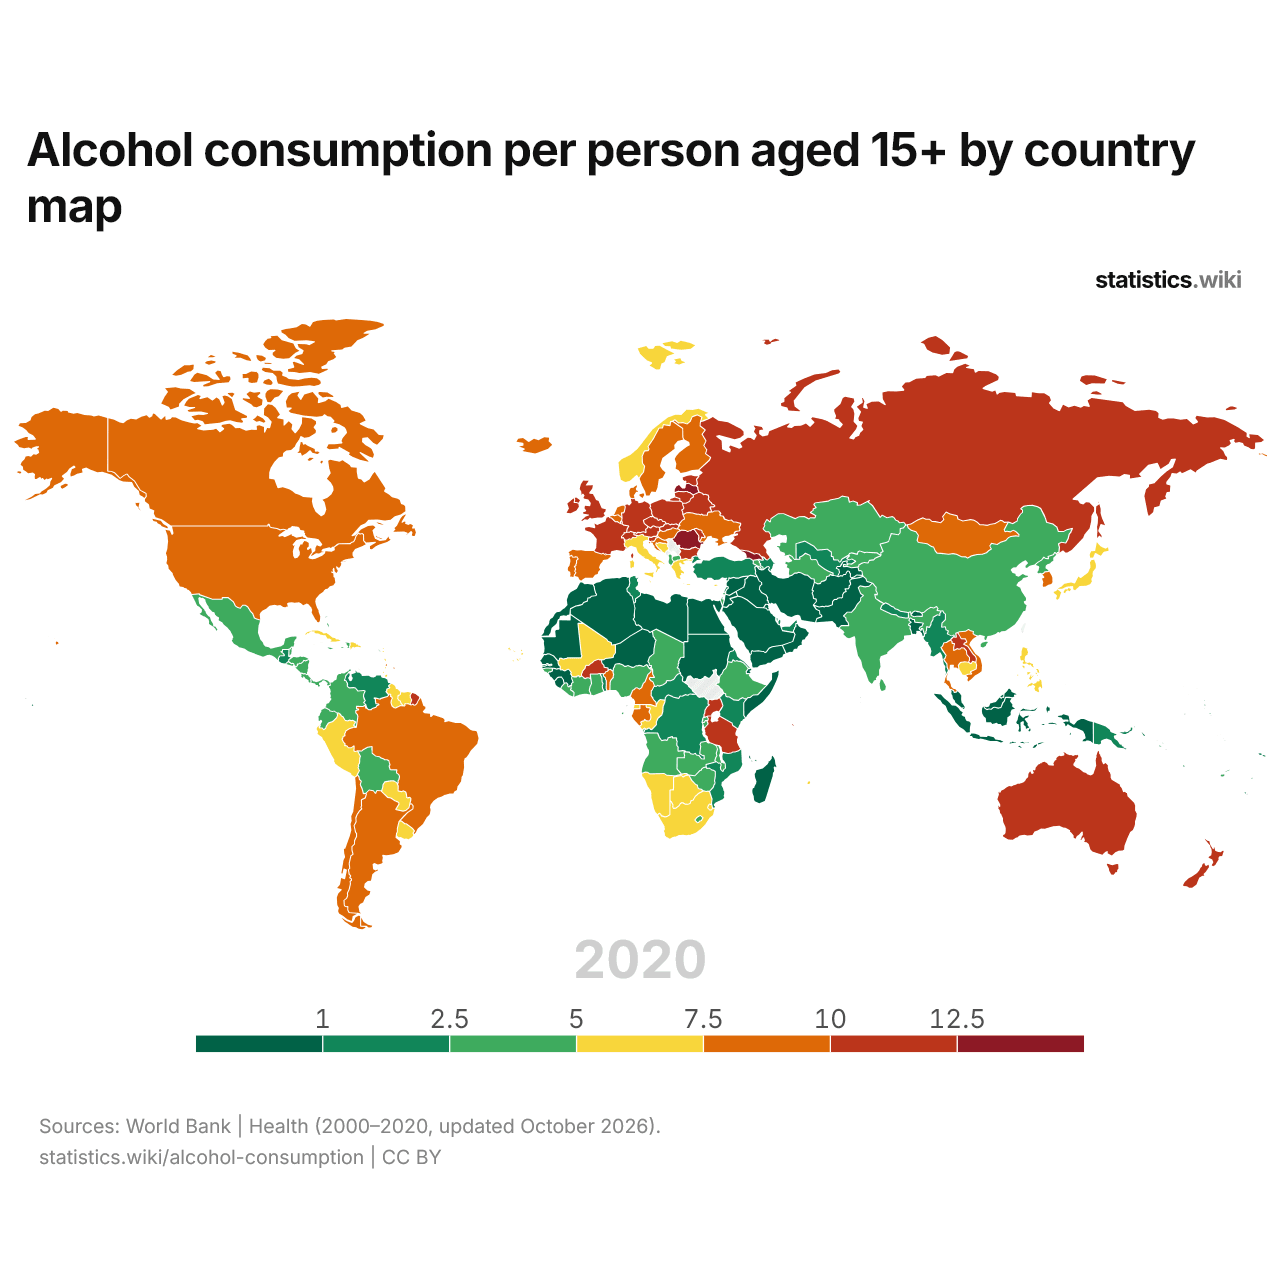
People aged 15+ drink more than 10 liters of pure alcohol per person a year in 27 countries and less than 1 in 34; in 2000, the numbers were 33 and 33.
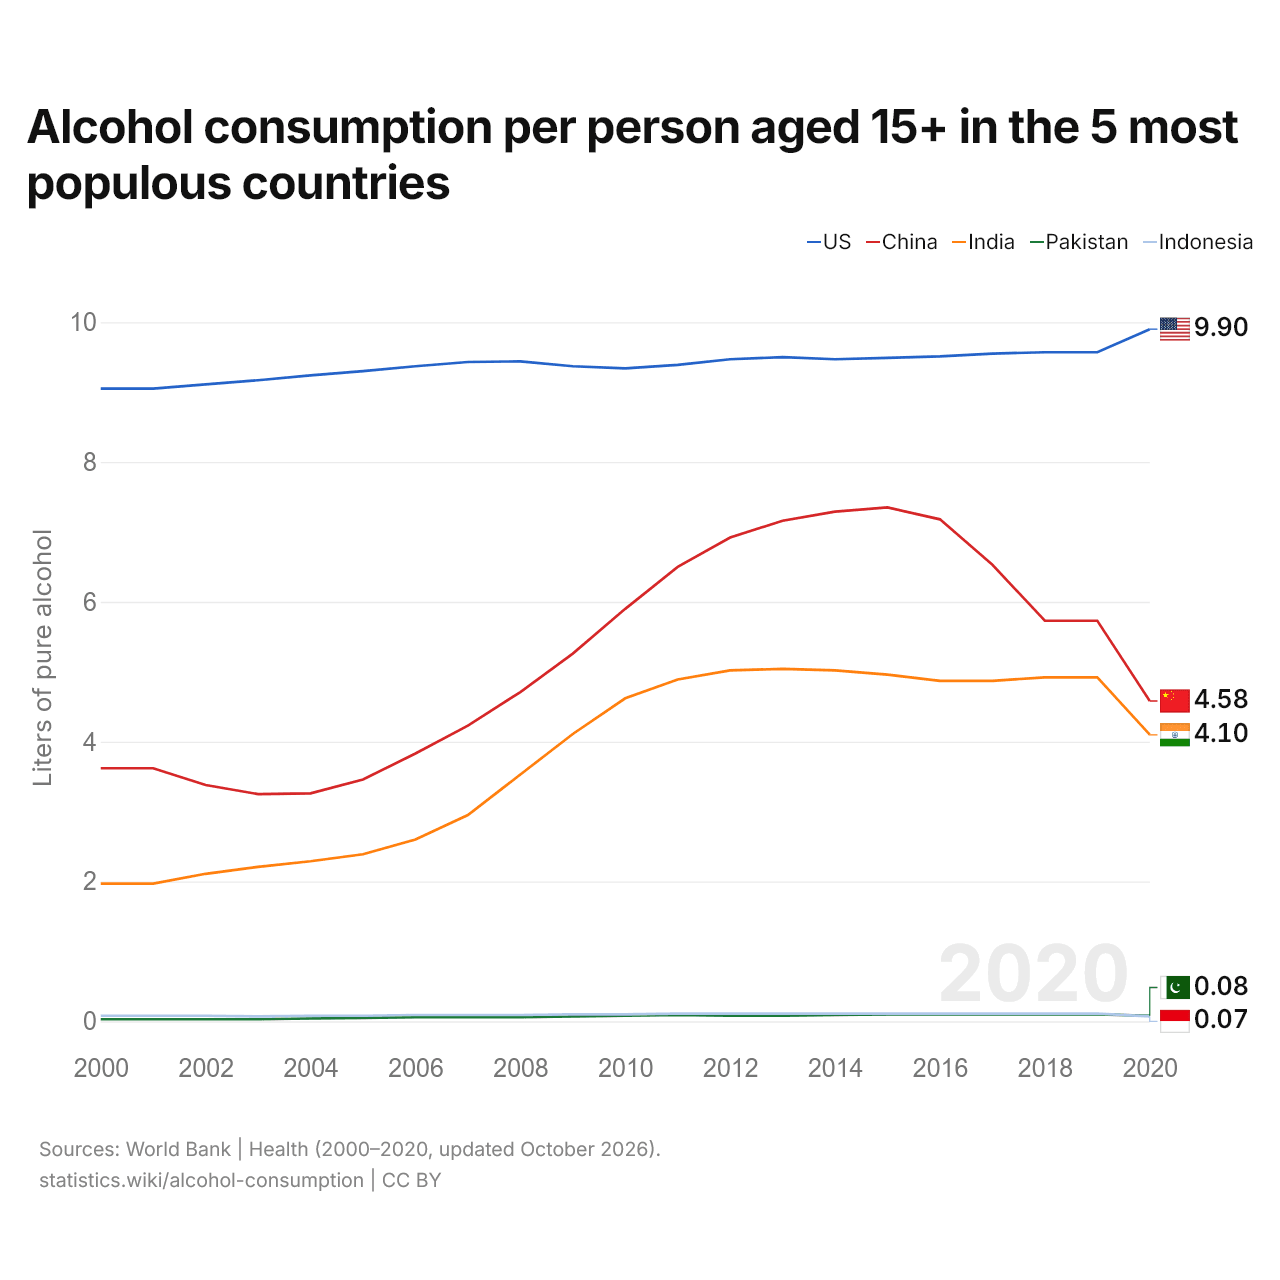
Alcohol consumption per person aged 15+ in the 5 most populous countries
| Year | Liters of pure alcohol | ||||
|---|---|---|---|---|---|
| United States | China | India | Pakistan | Indonesia | |
| 2020 | 9.9 | 4.58 | 4.1 | 0.08 | 0.07 |
| 2019 | 9.57 | 5.73 | 4.92 | 0.1 | 0.11 |
| 2018 | 9.57 | 5.73 | 4.92 | 0.1 | 0.11 |
| 2017 | 9.55 | 6.53 | 4.87 | 0.1 | 0.11 |
| 2016 | 9.51 | 7.18 | 4.87 | 0.1 | 0.11 |
| 2015 | 9.49 | 7.35 | 4.96 | 0.1 | 0.11 |
| 2014 | 9.47 | 7.29 | 5.02 | 0.09 | 0.11 |
| 2013 | 9.5 | 7.16 | 5.04 | 0.08 | 0.11 |
| 2012 | 9.47 | 6.92 | 5.02 | 0.08 | 0.11 |
| 2011 | 9.39 | 6.5 | 4.89 | 0.09 | 0.11 |
| 2010 | 9.34 | 5.9 | 4.62 | 0.08 | 0.1 |
| 2009 | 9.37 | 5.26 | 4.11 | 0.07 | 0.1 |
| 2008 | 9.44 | 4.71 | 3.53 | 0.06 | 0.09 |
| 2007 | 9.43 | 4.23 | 2.95 | 0.06 | 0.09 |
| 2006 | 9.37 | 3.83 | 2.6 | 0.06 | 0.09 |
| 2005 | 9.3 | 3.46 | 2.39 | 0.05 | 0.08 |
| 2004 | 9.24 | 3.26 | 2.29 | 0.04 | 0.08 |
| 2003 | 9.17 | 3.25 | 2.21 | 0.03 | 0.07 |
| 2002 | 9.11 | 3.38 | 2.11 | 0.03 | 0.08 |
| 2001 | 9.05 | 3.62 | 1.97 | 0.03 | 0.08 |
| 2000 | 9.05 | 3.62 | 1.97 | 0.03 | 0.08 |
People aged 15+ drink 9.9 liters of pure alcohol per person a year in the United States, 4.58 in China, 4.1 in India, 0.08 in Pakistan and 0.07 in Indonesia. The United States' consumption has been the highest of the five every year since 2000. The most recent change in their order came in 2020, when Pakistan passed Indonesia.
The 10 countries with the highest alcohol consumption per person aged 15+
The 10 countries with the lowest alcohol consumption per person aged 15+
Of the ten countries with the highest consumption, nine are in Europe; of the ten with the lowest, six are in Asia.
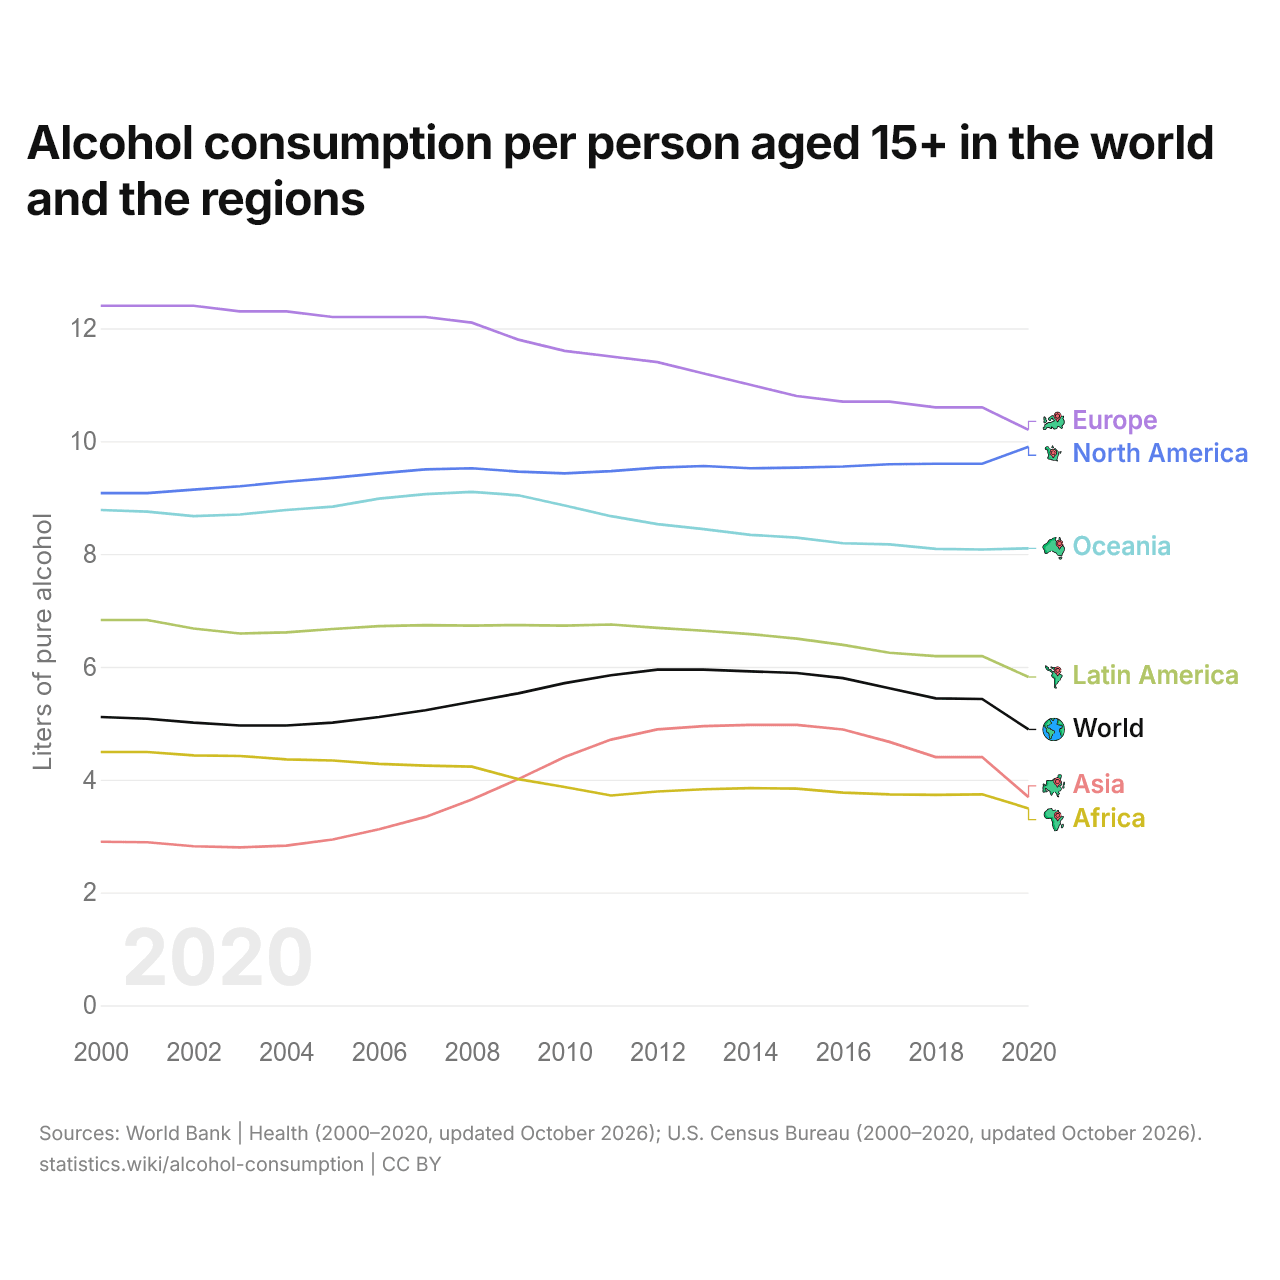
Alcohol consumption per person aged 15+ in the world and the regions
| Year | Liters of pure alcohol | ||||||
|---|---|---|---|---|---|---|---|
| World | Europe | North America | Oceania | Latin America | Asia | Africa | |
| 2020 | 4.89 | 10.2 | 9.9 | 8.1 | 5.82 | 3.69 | 3.49 |
| 2019 | 5.43 | 10.6 | 9.6 | 8.08 | 6.19 | 4.4 | 3.74 |
| 2018 | 5.44 | 10.6 | 9.6 | 8.09 | 6.19 | 4.4 | 3.73 |
| 2017 | 5.62 | 10.7 | 9.59 | 8.17 | 6.25 | 4.67 | 3.74 |
| 2016 | 5.8 | 10.7 | 9.55 | 8.19 | 6.39 | 4.89 | 3.77 |
| 2015 | 5.89 | 10.8 | 9.53 | 8.29 | 6.5 | 4.97 | 3.84 |
| 2014 | 5.92 | 11 | 9.52 | 8.34 | 6.58 | 4.97 | 3.85 |
| 2013 | 5.95 | 11.2 | 9.56 | 8.44 | 6.64 | 4.95 | 3.83 |
| 2012 | 5.95 | 11.4 | 9.53 | 8.53 | 6.69 | 4.89 | 3.79 |
| 2011 | 5.85 | 11.5 | 9.47 | 8.67 | 6.75 | 4.71 | 3.72 |
| 2010 | 5.71 | 11.6 | 9.43 | 8.86 | 6.73 | 4.4 | 3.87 |
| 2009 | 5.53 | 11.8 | 9.46 | 9.04 | 6.74 | 4.01 | 4.01 |
| 2008 | 5.38 | 12.1 | 9.52 | 9.1 | 6.73 | 3.65 | 4.23 |
| 2007 | 5.23 | 12.2 | 9.5 | 9.06 | 6.74 | 3.34 | 4.25 |
| 2006 | 5.11 | 12.2 | 9.43 | 8.98 | 6.72 | 3.12 | 4.28 |
| 2005 | 5.01 | 12.2 | 9.35 | 8.84 | 6.67 | 2.94 | 4.34 |
| 2004 | 4.96 | 12.3 | 9.28 | 8.78 | 6.61 | 2.83 | 4.36 |
| 2003 | 4.96 | 12.3 | 9.2 | 8.7 | 6.59 | 2.8 | 4.42 |
| 2002 | 5.01 | 12.4 | 9.14 | 8.67 | 6.68 | 2.82 | 4.43 |
| 2001 | 5.08 | 12.4 | 9.08 | 8.75 | 6.83 | 2.89 | 4.49 |
| 2000 | 5.11 | 12.4 | 9.08 | 8.78 | 6.83 | 2.9 | 4.49 |
Consumption is highest in Europe, at 10.2 liters of pure alcohol per person aged 15+, and lowest in Africa, at 3.49.
Compare the alcohol consumption of any 2 countries
Sources:
- World Bank | Health (2000–2020, updated October 2026)
- U.S. Census Bureau (2000–2020, updated October 2026)
Creative Commons Attribution (CC BY): you may copy, share, adapt and reuse this content, also commercially, as long as you credit statistics.wiki and note any changes you made. The sources listed above may have their own license terms.