
El Salvador alcohol consumption per person aged 15+
1x
| Year | Liters of pure alcohol | World rank |
|---|---|---|
| El Salvador | ||
| 2020 | 3.15 | #113 |
| 2019 | 3.28 | #118 |
| 2018 | 3.28 | #118 |
| 2017 | 3.15 | #119 |
| 2016 | 3.01 | #121 |
| 2015 | 2.89 | #123 |
| 2014 | 2.78 | #126 |
| 2013 | 2.74 | #127 |
| 2012 | 2.69 | #127 |
| 2011 | 2.68 | #126 |
| 2010 | 2.71 | #126 |
| 2009 | 2.81 | #124 |
| 2008 | 2.98 | #120 |
| 2007 | 3.05 | #118 |
| 2006 | 3.08 | #118 |
| 2005 | 3.09 | #116 |
| 2004 | 3.18 | #114 |
| 2003 | 3.24 | #114 |
| 2002 | 3.23 | #113 |
| 2001 | 3.14 | #114 |
| 2000 | 3.14 | #114 |
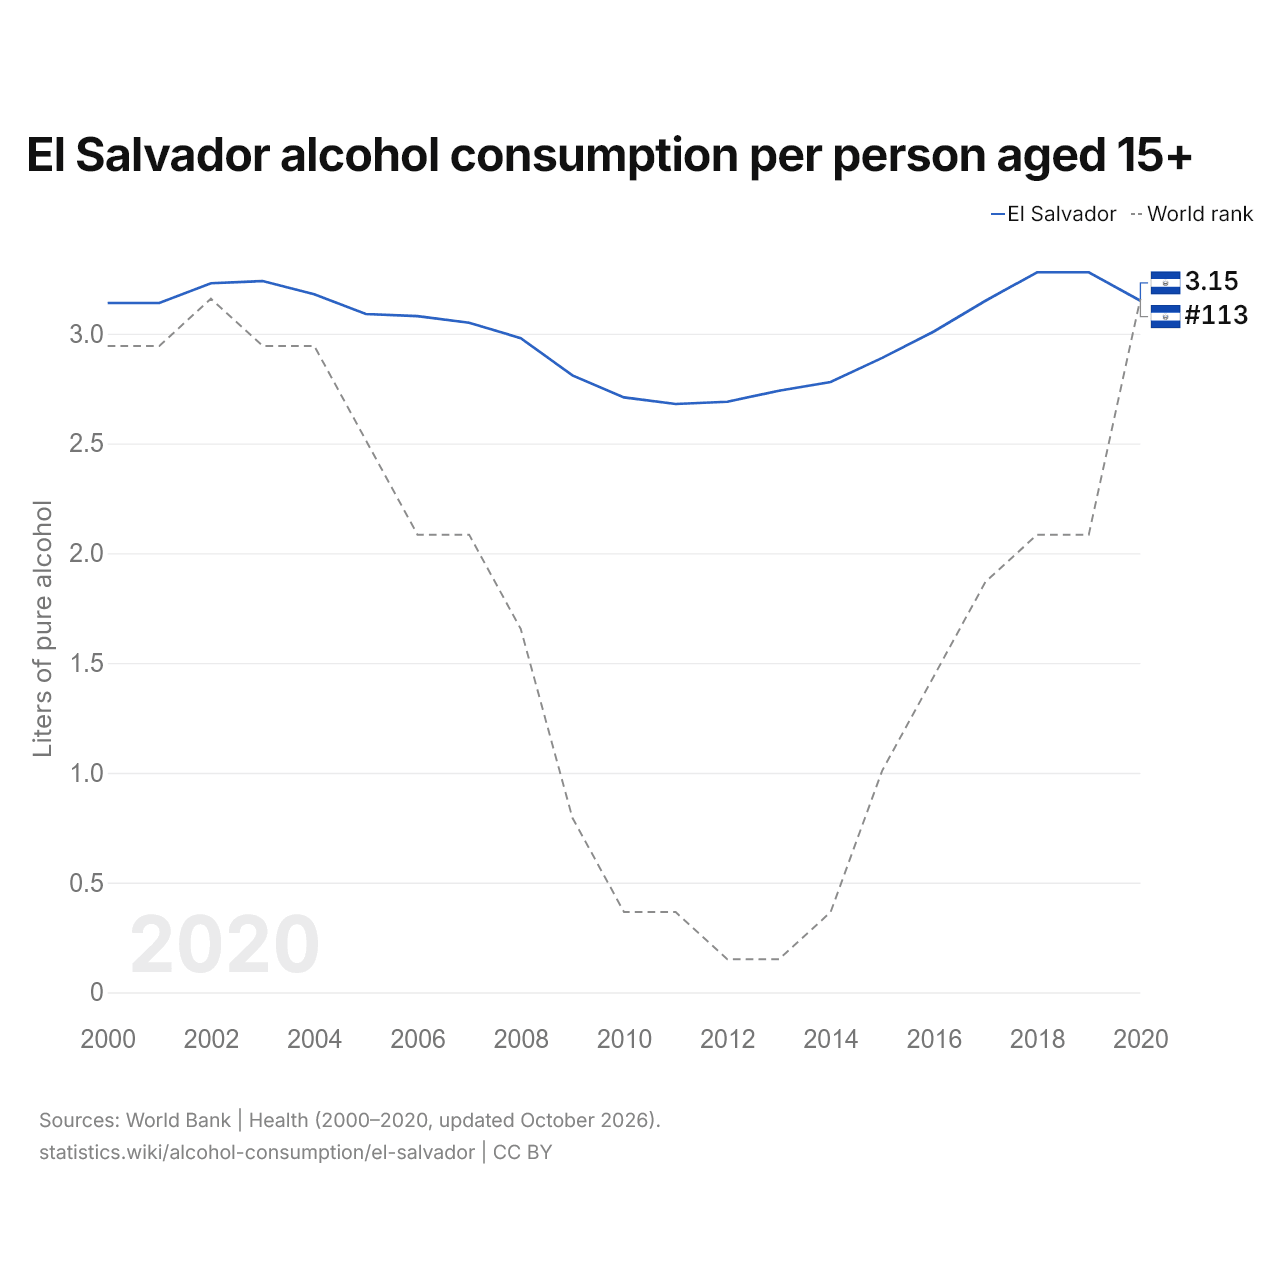
People aged 15+ in El Salvador drink 3.15 liters of pure alcohol per person a year, up from 3.14 in 2000. Consumption was highest in 2018, at 3.28 liters. It is the 113th highest in the world, up from 118th the year before.
Alcohol consumption per person aged 15+ in El Salvador is the 27th highest of 33 countries in Latin America, where it ranges from Guatemala's 1.54 liters to Saint Lucia's 9.28 liters.
El Salvador in the world ranking of alcohol consumption per person aged 15+
| Rank | Country | Liters per year | Beer bottles per week | Change since 2000, liters | |
|---|---|---|---|---|---|
| 110 |
 Bolivia |
3.6 | 4.2 | +0.5 | vs Bolivia |
| 111 |
 Fiji |
3.6 | 4.2 | +1.2 | |
| 112 |
 Costa Rica |
3.4 | 4.0 | −1.2 | vs Costa Rica |
| 113 |
 El Salvador |
3.2 | 3.7 | +0.0 | |
| 114 |
 Haiti |
3.1 | 3.6 | −1.0 | |
| 115 |
 Jamaica |
3.1 | 3.6 | −0.2 | |
| 116 |
 Honduras |
3.1 | 3.6 | +0.0 | vs Honduras |
Compare the alcohol consumption of El Salvador with other countries
Sources:
- World Bank | Health (2000–2020, updated October 2026)
Creative Commons Attribution (CC BY): you may copy, share, adapt and reuse this content, also commercially, as long as you credit statistics.wiki and note any changes you made. The sources listed above may have their own license terms.