
Russia vs Austria agricultural land area chart
1x
| Year | Agricultural land, mi² | |
|---|---|---|
| Russia | Austria | |
| 2024 | 832,869 | 9,910 |
| 2023 | 832,826 | 9,920 |
| 2022 | 832,533 | 10,029 |
| 2021 | 832,537 | 10,048 |
| 2020 | 832,027 | 10,049 |
| 2019 | 832,027 | 10,236 |
| 2018 | 832,027 | 10,243 |
| 2017 | 832,027 | 10,249 |
| 2016 | 832,027 | 10,310 |
| 2015 | 832,027 | 10,496 |
| 2014 | 832,027 | 10,480 |
| 2013 | 832,027 | 10,488 |
| 2012 | 832,027 | 10,561 |
| 2011 | 832,027 | 10,646 |
| 2010 | 832,027 | 10,731 |
| 2009 | 832,027 | 10,792 |
| 2008 | 832,027 | 10,847 |
| 2007 | 831,907 | 10,927 |
| 2006 | 832,004 | 10,978 |
| 2005 | 832,745 | 11,030 |
| 2004 | 833,903 | 11,071 |
| 2003 | 835,050 | 11,140 |
| 2002 | 836,494 | 11,205 |
| 2001 | 837,305 | 11,259 |
| 2000 | 838,467 | 11,352 |
| 1999 | 837,031 | 11,410 |
| 1998 | 838,950 | 11,428 |
| 1997 | 841,660 | 11,446 |
| 1996 | 834,409 | 11,480 |
| 1995 | 835,525 | 11,510 |
| 1994 | 840,587 | 11,560 |
| 1993 | 844,772 | 11,579 |
| 1992 | 855,722 | 11,633 |
| 1991 | - | 11,726 |
| 1990 | - | 11,675 |
| 1989 | - | 11,778 |
| 1988 | - | 11,770 |
| 1987 | - | 11,691 |
| 1986 | - | 11,687 |
| 1985 | - | 11,728 |
| 1984 | - | 11,711 |
| 1983 | - | 11,683 |
| 1982 | - | 12,134 |
| 1981 | - | 12,183 |
| 1980 | - | 12,127 |
| 1979 | - | 12,135 |
| 1978 | - | 12,281 |
| 1977 | - | 12,269 |
| 1976 | - | 12,292 |
| 1975 | - | 12,315 |
| 1974 | - | 12,383 |
| 1973 | - | 12,441 |
| 1972 | - | 12,769 |
| 1971 | - | 12,822 |
| 1970 | - | 12,880 |
| 1969 | - | 12,939 |
| 1968 | - | 12,970 |
| 1967 | - | 13,026 |
| 1966 | - | 13,151 |
| 1965 | - | 13,375 |
| 1964 | - | 13,423 |
| 1963 | - | 13,474 |
| 1962 | - | 13,633 |
| 1961 | - | 13,727 |
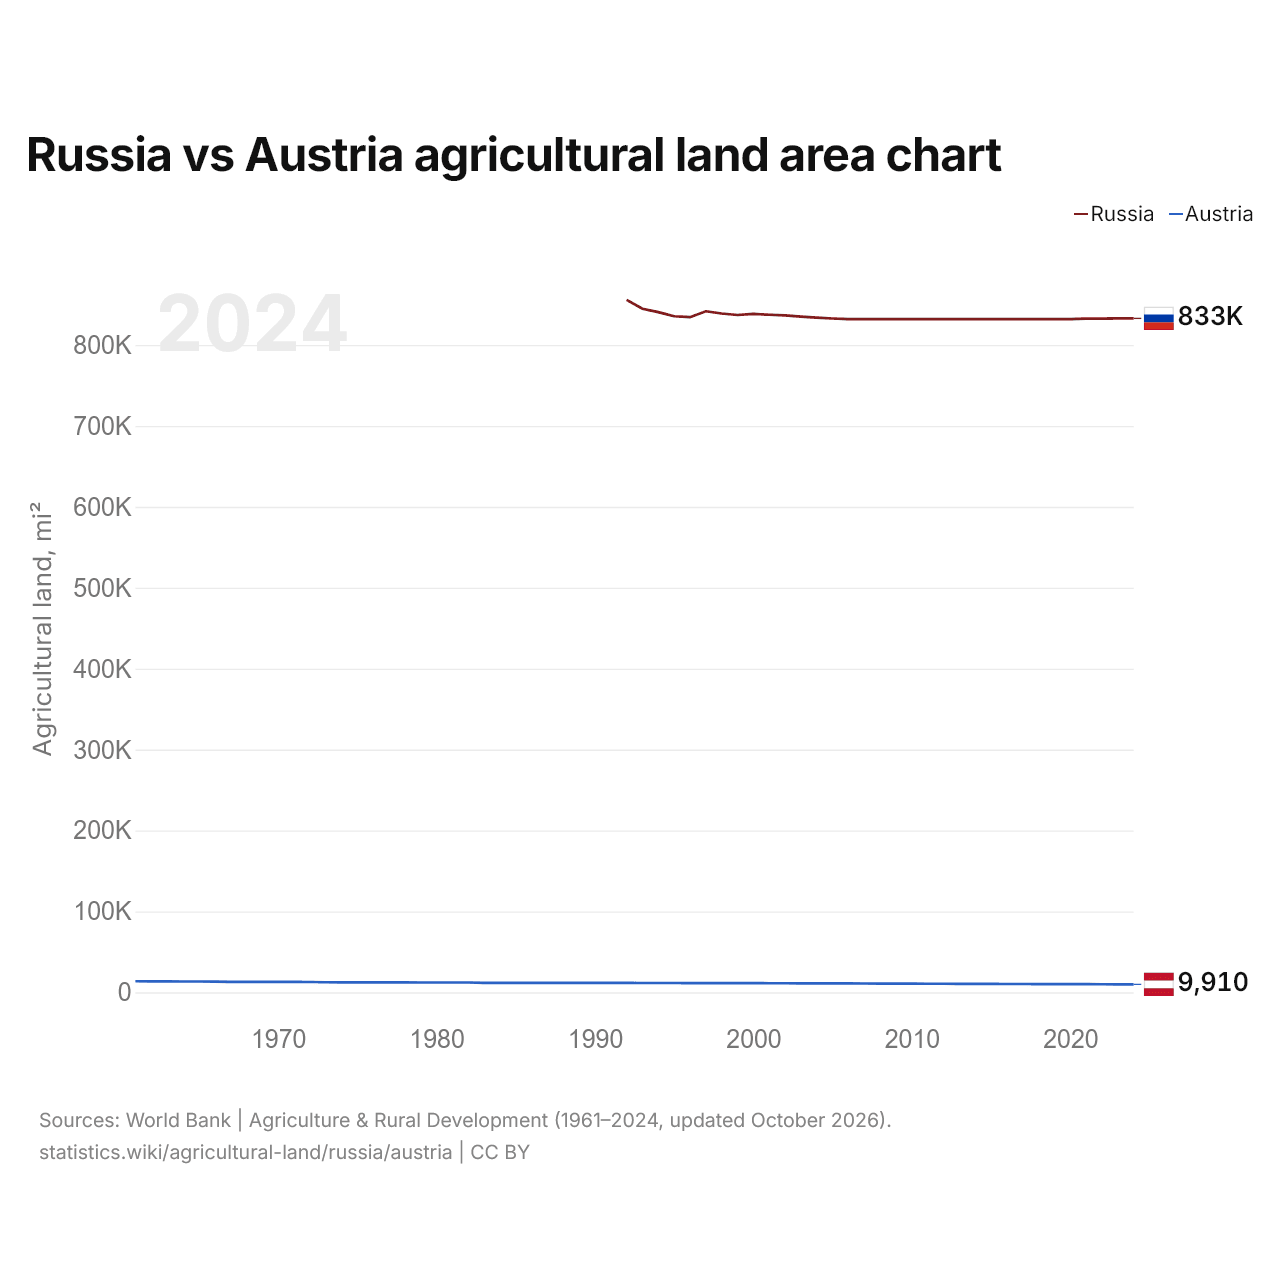
Agricultural land covers 832,869 mi² (2,157,120 km²) in Russia and 9,910 mi² (25,667 km²) in Austria: Russia's agricultural land is 84 times Austria's. In 1992, Russia had 855,722 mi² (2,216,310 km²) and Austria 11,633 mi² (30,130 km²); Russia's agricultural land was then 74 times Austria's.
Agricultural land covers 13.2% of Russia's land area and 31.1% of Austria's; arable land covers 7.4% and 16.0%.
Russia vs Austria: agricultural land, area and % of land area
 Russia |
 Austria |
|
|---|---|---|
| Agricultural land | 832,869 mi² | 9,910 mi² |
| Agricultural land, % | 13.2% | 31.1% |
| Arable land | 469,689 mi² | 5,100 mi² |
| Arable land, % | 7.4% | 16.0% |
| Permanent crops | 7,765 mi² | 246.3 mi² |
| Permanent crops, % | 0.1% | 0.8% |
| Meadows and pastures | 355,415 mi² | 4,564 mi² |
| Meadows and pastures, % | 5.6% | 14.3% |
| Arable land per person | 2.09 acres per person | 0.36 acres per person |
| World rank by agricultural land | #5 of 194 | #109 of 194 |
| World rank by arable land | #3 of 191 | #95 of 191 |
| World rank by arable land per person | #6 of 191 | #85 of 191 |
Compare the agricultural land of any 2 countries
Sources:
- World Bank | Agriculture & Rural Development (1961–2024, updated October 2026)
Creative Commons Attribution (CC BY): you may copy, share, adapt and reuse this content, also commercially, as long as you credit statistics.wiki and note any changes you made. The sources listed above may have their own license terms.