
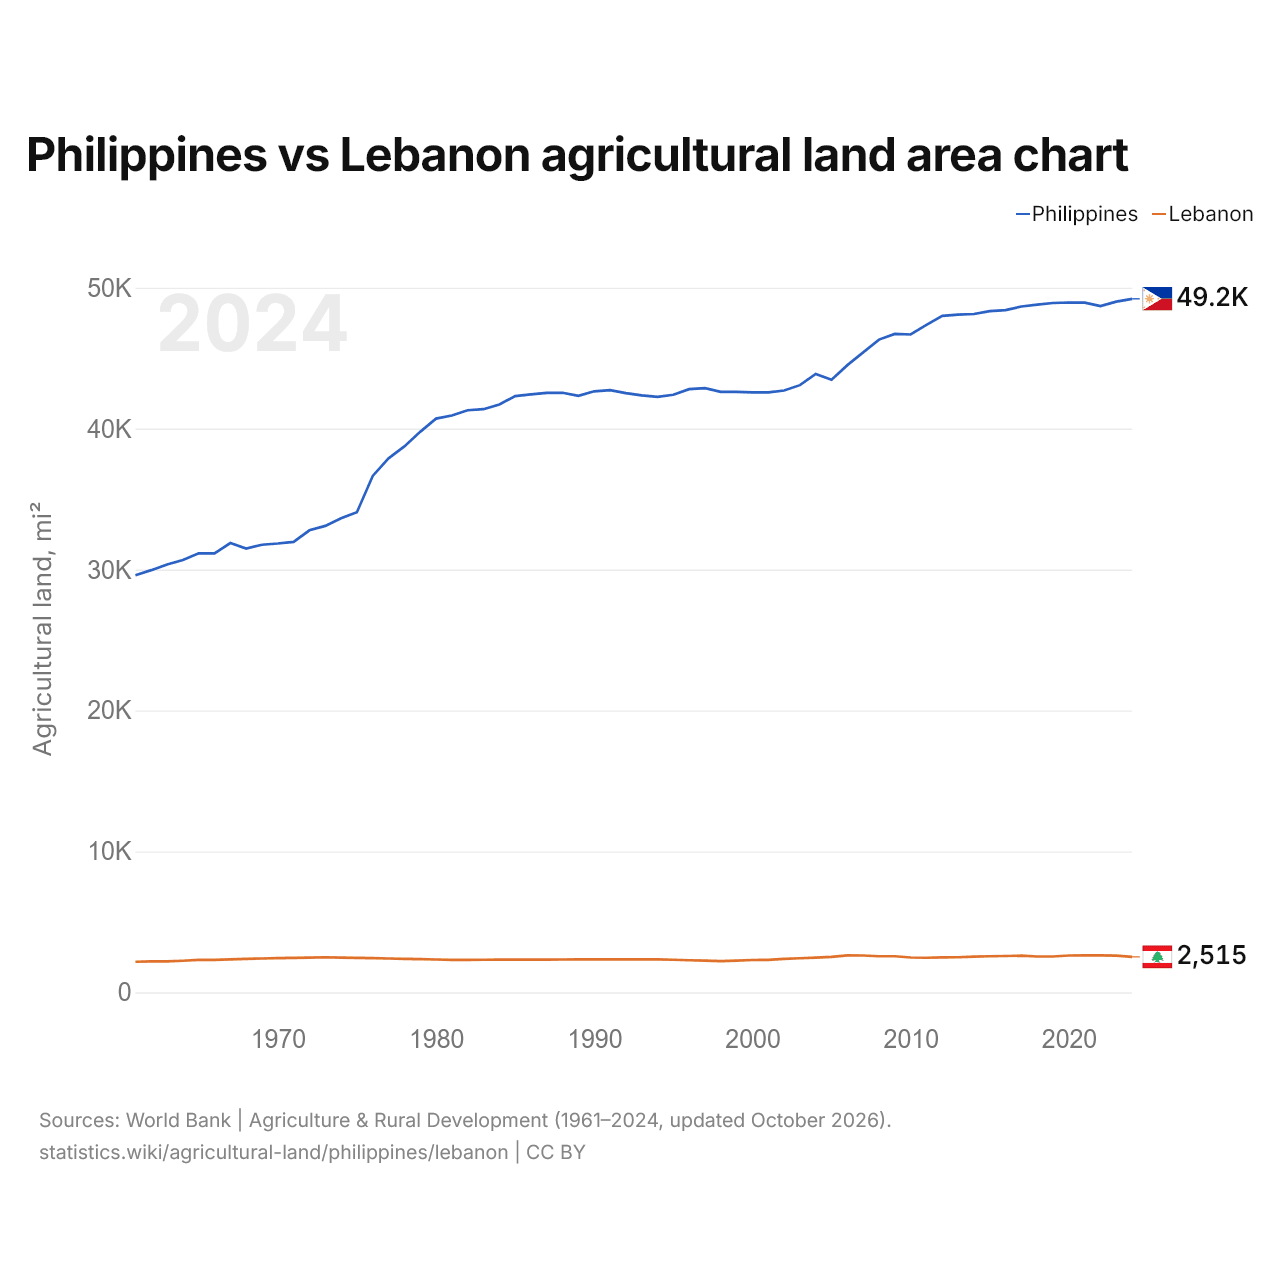
Philippines vs Lebanon agricultural land area chart
1x
| Year | Agricultural land, mi² | |
|---|---|---|
| Philippines | Lebanon | |
| 2024 | 49,211 | 2,515 |
| 2023 | 49,014 | 2,610 |
| 2022 | 48,699 | 2,623 |
| 2021 | 48,943 | 2,623 |
| 2020 | 48,948 | 2,615 |
| 2019 | 48,911 | 2,541 |
| 2018 | 48,801 | 2,541 |
| 2017 | 48,665 | 2,600 |
| 2016 | 48,413 | 2,576 |
| 2015 | 48,341 | 2,561 |
| 2014 | 48,131 | 2,533 |
| 2013 | 48,090 | 2,488 |
| 2012 | 48,005 | 2,480 |
| 2011 | 47,361 | 2,455 |
| 2010 | 46,677 | 2,471 |
| 2009 | 46,723 | 2,560 |
| 2008 | 46,316 | 2,560 |
| 2007 | 45,408 | 2,614 |
| 2006 | 44,505 | 2,622 |
| 2005 | 43,475 | 2,521 |
| 2004 | 43,883 | 2,464 |
| 2003 | 43,084 | 2,421 |
| 2002 | 42,705 | 2,378 |
| 2001 | 42,576 | 2,309 |
| 2000 | 42,572 | 2,297 |
| 1999 | 42,606 | 2,249 |
| 1998 | 42,606 | 2,214 |
| 1997 | 42,874 | 2,246 |
| 1996 | 42,803 | 2,279 |
| 1995 | 42,399 | 2,311 |
| 1994 | 42,257 | 2,344 |
| 1993 | 42,361 | 2,342 |
| 1992 | 42,521 | 2,341 |
| 1991 | 42,736 | 2,340 |
| 1990 | 42,646 | 2,336 |
| 1989 | 42,324 | 2,333 |
| 1988 | 42,545 | 2,329 |
| 1987 | 42,531 | 2,326 |
| 1986 | 42,432 | 2,323 |
| 1985 | 42,308 | 2,319 |
| 1984 | 41,711 | 2,316 |
| 1983 | 41,381 | 2,312 |
| 1982 | 41,305 | 2,309 |
| 1981 | 40,929 | 2,309 |
| 1980 | 40,710 | 2,332 |
| 1979 | 39,770 | 2,354 |
| 1978 | 38,736 | 2,377 |
| 1977 | 37,893 | 2,400 |
| 1976 | 36,642 | 2,422 |
| 1975 | 34,066 | 2,445 |
| 1974 | 33,638 | 2,468 |
| 1973 | 33,099 | 2,490 |
| 1972 | 32,785 | 2,468 |
| 1971 | 31,965 | 2,446 |
| 1970 | 31,847 | 2,423 |
| 1969 | 31,762 | 2,401 |
| 1968 | 31,494 | 2,378 |
| 1967 | 31,879 | 2,340 |
| 1966 | 31,152 | 2,301 |
| 1965 | 31,155 | 2,301 |
| 1964 | 30,675 | 2,239 |
| 1963 | 30,357 | 2,201 |
| 1962 | 29,958 | 2,201 |
| 1961 | 29,601 | 2,170 |
Agricultural land covers 49,211 mi² (127,455 km²) in the Philippines and 2,515 mi² (6,513 km²) in Lebanon: the Philippines' agricultural land is 20 times Lebanon's. In 1961, the Philippines had 29,601 mi² (76,667 km²) and Lebanon 2,170 mi² (5,620 km²); the Philippines' agricultural land was then 14 times Lebanon's.
Agricultural land covers 42.7% of the Philippines' land area and 63.7% of Lebanon's; arable land covers 18.7% and 10.8%.
Philippines vs Lebanon: agricultural land, area and % of land area
 Philippines |
 Lebanon |
|
|---|---|---|
| Agricultural land | 49,211 mi² | 2,515 mi² |
| Agricultural land, % | 42.7% | 63.7% |
| Arable land | 21,583 mi² | 426 mi² |
| Arable land, % | 18.7% | 10.8% |
| Permanent crops | 21,836 mi² | 544 mi² |
| Permanent crops, % | 19.0% | 13.8% |
| Meadows and pastures | 5,792 mi² | 1,544 mi² |
| Meadows and pastures, % | 5.0% | 39.1% |
| Arable land per person | 0.12 acres per person | 0.05 acres per person |
| World rank by agricultural land | #64 of 194 | #146 of 194 |
| World rank by arable land | #45 of 191 | #146 of 191 |
| World rank by arable land per person | #148 of 191 | #170 of 191 |
Compare the agricultural land of any 2 countries
Sources:
- World Bank | Agriculture & Rural Development (1961–2024, updated October 2026)
Creative Commons Attribution (CC BY): you may copy, share, adapt and reuse this content, also commercially, as long as you credit statistics.wiki and note any changes you made. The sources listed above may have their own license terms.