
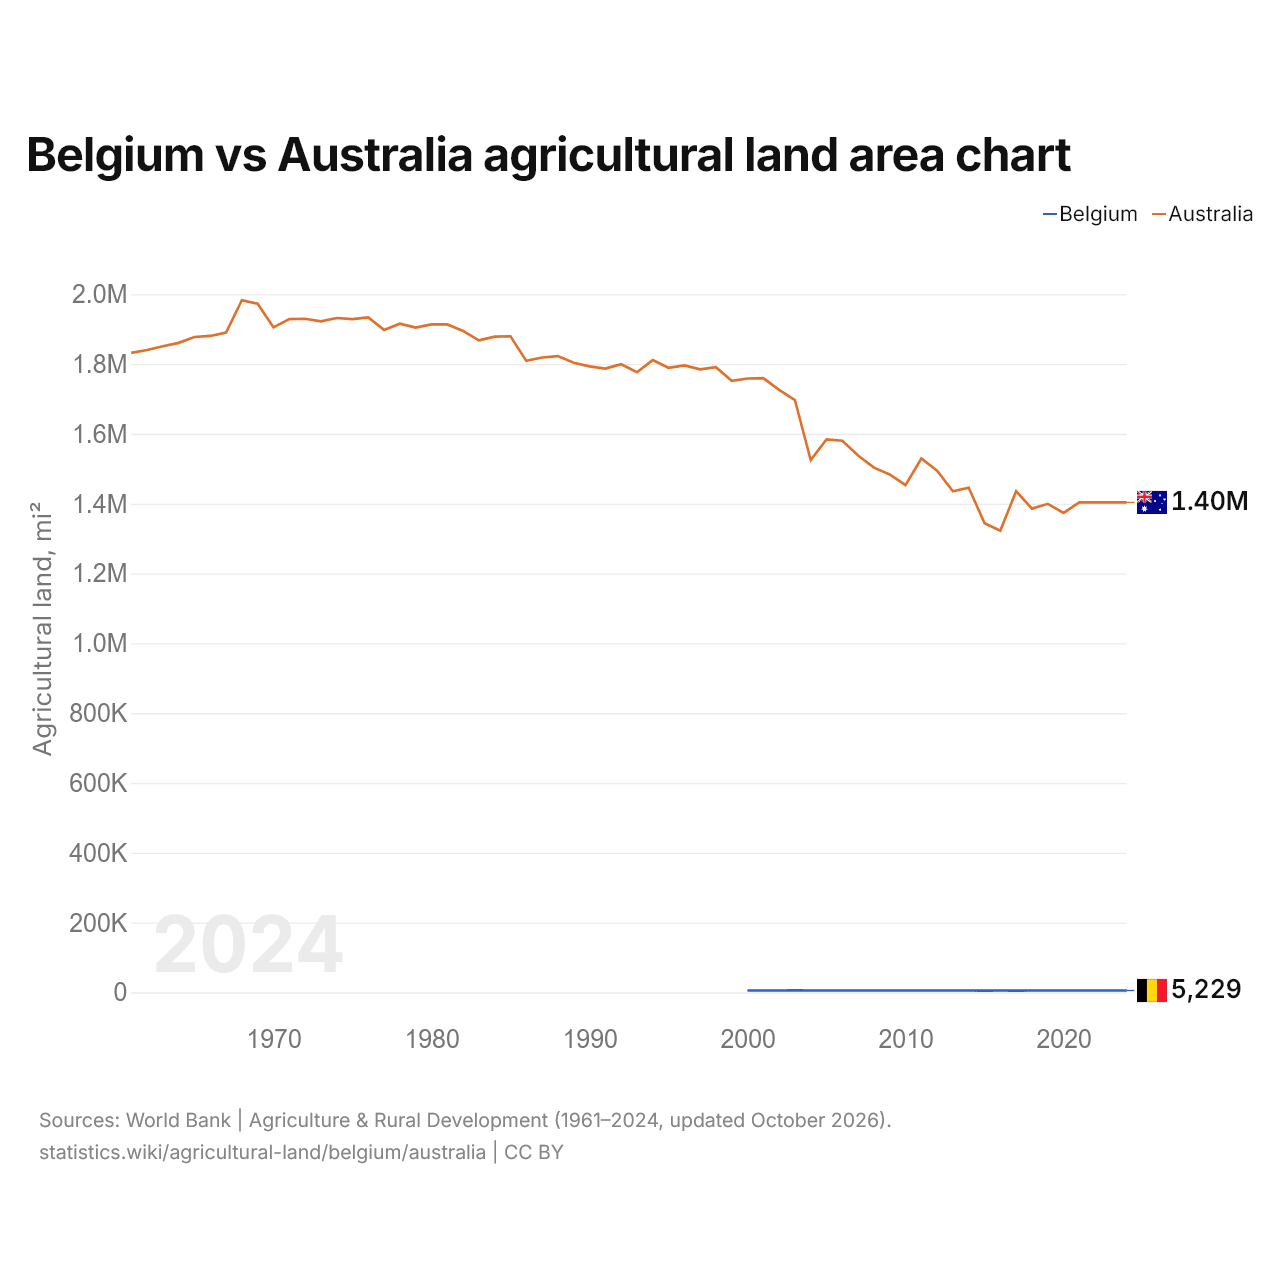
Belgium vs Australia agricultural land area chart
1x
| Year | Agricultural land, mi² | |
|---|---|---|
| Belgium | Australia | |
| 2024 | 5,229 | 1,403,555 |
| 2023 | 5,225 | 1,403,555 |
| 2022 | 5,247 | 1,403,555 |
| 2021 | 5,273 | 1,403,555 |
| 2020 | 5,269 | 1,373,655 |
| 2019 | 5,236 | 1,399,532 |
| 2018 | 5,228 | 1,385,701 |
| 2017 | 5,124 | 1,435,671 |
| 2016 | 5,215 | 1,322,794 |
| 2015 | 5,127 | 1,344,095 |
| 2014 | 5,140 | 1,445,655 |
| 2013 | 5,160 | 1,435,431 |
| 2012 | 5,143 | 1,494,509 |
| 2011 | 5,157 | 1,529,432 |
| 2010 | 5,234 | 1,453,180 |
| 2009 | 5,265 | 1,483,625 |
| 2008 | 5,271 | 1,503,049 |
| 2007 | 5,278 | 1,538,059 |
| 2006 | 5,328 | 1,580,324 |
| 2005 | 5,340 | 1,583,907 |
| 2004 | 5,372 | 1,524,741 |
| 2003 | 5,375 | 1,696,919 |
| 2002 | 5,363 | 1,725,877 |
| 2001 | 5,354 | 1,759,468 |
| 2000 | 5,365 | 1,758,576 |
| 1999 | - | 1,751,718 |
| 1998 | - | 1,791,055 |
| 1997 | - | 1,784,692 |
| 1996 | - | 1,796,263 |
| 1995 | - | 1,789,151 |
| 1994 | - | 1,811,371 |
| 1993 | - | 1,776,444 |
| 1992 | - | 1,799,252 |
| 1991 | - | 1,786,811 |
| 1990 | - | 1,793,201 |
| 1989 | - | 1,803,499 |
| 1988 | - | 1,822,603 |
| 1987 | - | 1,818,618 |
| 1986 | - | 1,809,047 |
| 1985 | - | 1,879,511 |
| 1984 | - | 1,878,611 |
| 1983 | - | 1,867,920 |
| 1982 | - | 1,894,881 |
| 1981 | - | 1,913,387 |
| 1980 | - | 1,913,669 |
| 1979 | - | 1,904,403 |
| 1978 | - | 1,915,453 |
| 1977 | - | 1,897,731 |
| 1976 | - | 1,933,376 |
| 1975 | - | 1,928,762 |
| 1974 | - | 1,931,889 |
| 1973 | - | 1,922,391 |
| 1972 | - | 1,929,797 |
| 1971 | - | 1,928,720 |
| 1970 | - | 1,905,154 |
| 1969 | - | 1,972,550 |
| 1968 | - | 1,982,903 |
| 1967 | - | 1,890,281 |
| 1966 | - | 1,880,428 |
| 1965 | - | 1,877,457 |
| 1964 | - | 1,860,641 |
| 1963 | - | 1,850,856 |
| 1962 | - | 1,840,135 |
| 1961 | - | 1,831,995 |
Agricultural land covers 5,229 mi² (13,542 km²) in Belgium and 1,403,555 mi² (3,635,190 km²) in Australia: Australia's agricultural land is 270 times Belgium's. In 2000, Belgium had 5,365 mi² (13,896 km²) and Australia 1,758,576 mi² (4,554,690 km²); Australia's agricultural land was then 330 times Belgium's.
Agricultural land covers 44.4% of Belgium's land area and 47.3% of Australia's; arable land covers 28.3% and 4.1%.
Belgium vs Australia: agricultural land, area and % of land area
 Belgium |
 Australia |
|
|---|---|---|
| Agricultural land | 5,228 mi² | 1,403,555 mi² |
| Agricultural land, % | 44.4% | 47.3% |
| Arable land | 3,333 mi² | 120,715 mi² |
| Arable land, % | 28.3% | 4.1% |
| Permanent crops | 90.1 mi² | 1,486 mi² |
| Permanent crops, % | 0.8% | 0.1% |
| Meadows and pastures | 1,805 mi² | 1,281,353 mi² |
| Meadows and pastures, % | 15.3% | 43.2% |
| Arable land per person | 0.18 acres per person | 2.84 acres per person |
| World rank by agricultural land | #133 of 194 | #3 of 194 |
| World rank by arable land | #110 of 191 | #10 of 191 |
| World rank by arable land per person | #132 of 191 | #2 of 191 |
Compare the agricultural land of any 2 countries
Sources:
- World Bank | Agriculture & Rural Development (1961–2024, updated October 2026)
Creative Commons Attribution (CC BY): you may copy, share, adapt and reuse this content, also commercially, as long as you credit statistics.wiki and note any changes you made. The sources listed above may have their own license terms.