
Venezuela vs El Salvador average age of mothers, 1960–2026
1x
| Year | Average age at childbirth | |
|---|---|---|
 Venezuela |
 El Salvador |
|
| 2026 projected | 26.3 | 27.2 |
| 2025 projected | 26.3 | 27.2 |
| 2024 | 26.3 | 27.2 |
| 2023 | 26.3 | 27.1 |
| 2022 | 26.3 | 27.1 |
| 2021 | 26.3 | 27.1 |
| 2020 | 26.3 | 27.1 |
| 2019 | 26.3 | 27.1 |
| 2018 | 26.4 | 27.1 |
| 2017 | 26.3 | 27 |
| 2016 | 26.2 | 26.9 |
| 2015 | 26.2 | 26.9 |
| 2014 | 26.1 | 26.9 |
| 2013 | 26.1 | 26.8 |
| 2012 | 26.1 | 26.8 |
| 2011 | 26.1 | 26.8 |
| 2010 | 26.1 | 26.7 |
| 2009 | 26.2 | 26.7 |
| 2008 | 26.2 | 26.7 |
| 2007 | 26.2 | 26.7 |
| 2006 | 26.4 | 26.7 |
| 2005 | 26.5 | 26.8 |
| 2004 | 26.6 | 26.8 |
| 2003 | 26.7 | 26.8 |
| 2002 | 26.6 | 26.7 |
| 2001 | 26.6 | 26.7 |
| 2000 | 26.7 | 26.7 |
| 1999 | 26.7 | 26.7 |
| 1998 | 26.8 | 26.7 |
| 1997 | 26.9 | 26.7 |
| 1996 | 27 | 26.7 |
| 1995 | 27.1 | 26.8 |
| 1994 | 27.1 | 26.8 |
| 1993 | 27.1 | 27 |
| 1992 | 27.2 | 27 |
| 1991 | 27.2 | 27.1 |
| 1990 | 27.3 | 27.1 |
| 1989 | 27.4 | 27.2 |
| 1988 | 27.5 | 27.4 |
| 1987 | 27.6 | 27.5 |
| 1986 | 27.7 | 27.6 |
| 1985 | 28 | 27.7 |
| 1984 | 28.1 | 27.8 |
| 1983 | 28.1 | 27.8 |
| 1982 | 28.1 | 27.9 |
| 1981 | 28.1 | 28 |
| 1980 | 28.1 | 28 |
| 1979 | 28.1 | 28.1 |
| 1978 | 28.2 | 28.2 |
| 1977 | 28.3 | 28.3 |
| 1976 | 28.4 | 28.4 |
| 1975 | 28.4 | 28.5 |
| 1974 | 28.5 | 28.6 |
| 1973 | 28.5 | 28.7 |
| 1972 | 28.6 | 28.7 |
| 1971 | 28.7 | 28.8 |
| 1970 | 28.7 | 28.8 |
| 1969 | 28.7 | 28.8 |
| 1968 | 28.8 | 28.8 |
| 1967 | 28.8 | 28.8 |
| 1966 | 28.8 | 28.8 |
| 1965 | 28.8 | 28.9 |
| 1964 | 28.7 | 28.9 |
| 1963 | 28.7 | 28.9 |
| 1962 | 28.6 | 28.9 |
| 1961 | 28.6 | 28.9 |
| 1960 | 28.6 | 28.8 |
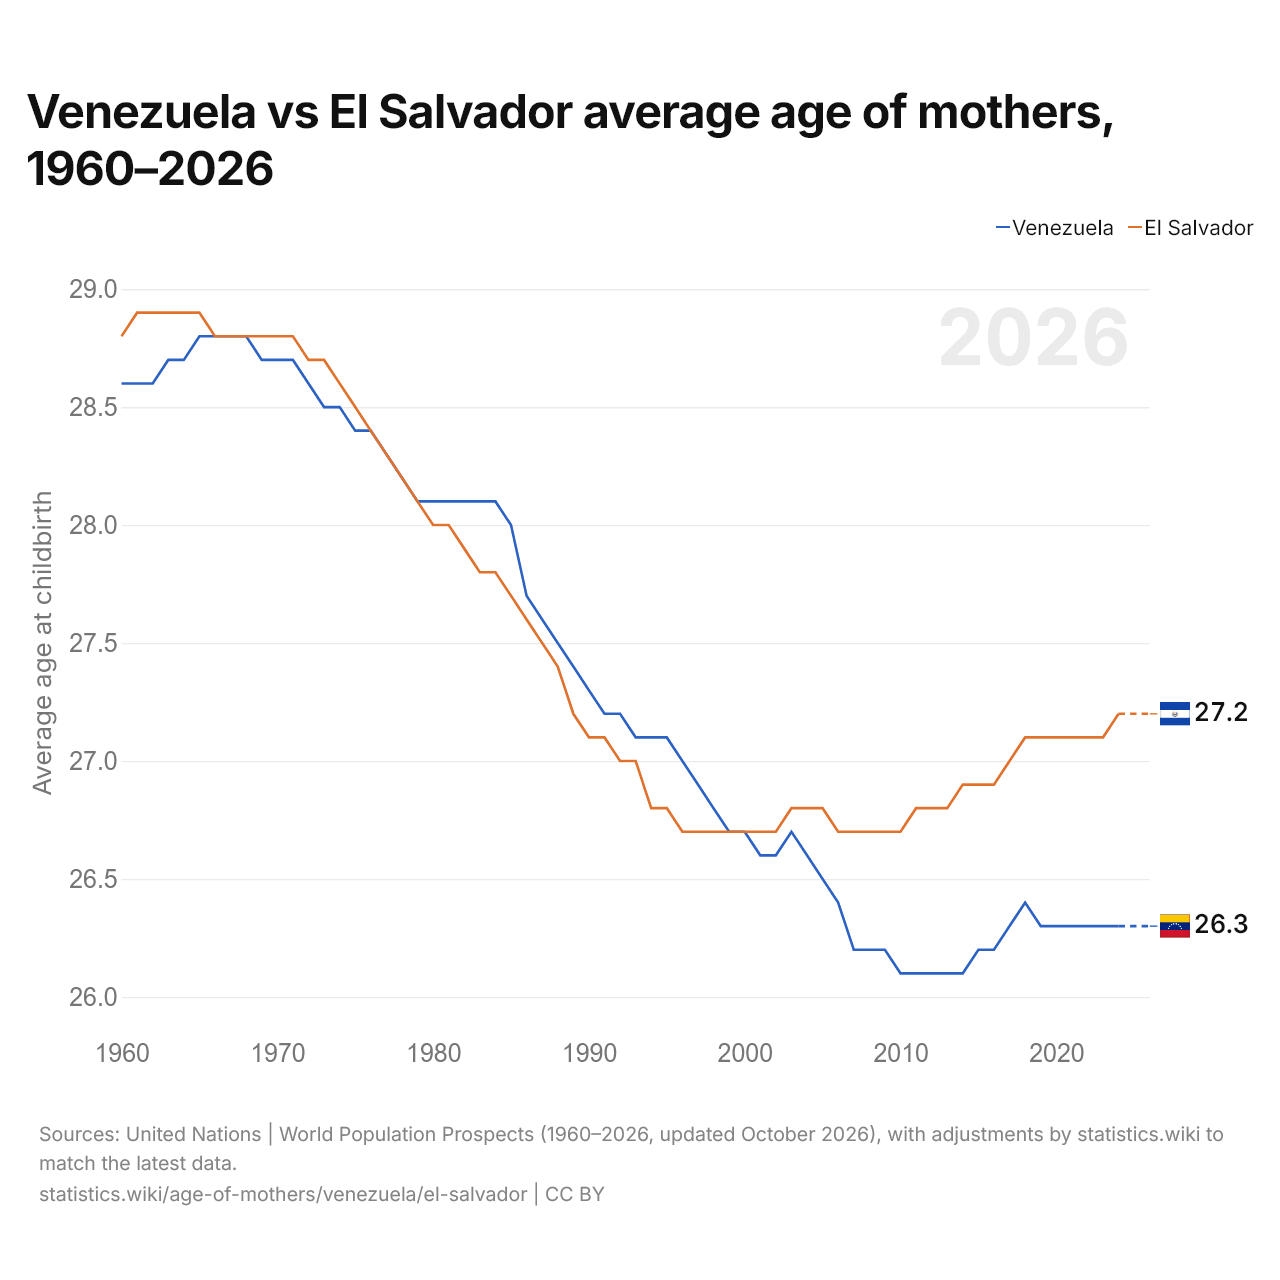
In 2026, the average age of mothers at childbirth is 26.3 years in Venezuela and 27.2 in El Salvador: 0.9 years higher in El Salvador. In 1960, it was 28.6 in Venezuela and 28.8 in El Salvador, 0.2 years higher in El Salvador.
El Salvador's average age of mothers has been higher than Venezuela's every year since 2001.
Venezuela vs El Salvador: age of mothers at childbirth, 2026
|
Venezuela
|
El Salvador
|
|
|---|---|---|
| At childbirth | 26.3 | 27.2 |
| World rank | 190/196 | 177/196 |
| Change since 1990 | −1.0 | +0.1 |
| Births to mothers 30+ | 22.5% | 32.6% |
Compare the average age of mothers in any 2 countries
Sources:
- United Nations | World Population Prospects (1960–2026, updated October 2026), with adjustments by statistics.wiki to match the latest data
Creative Commons Attribution (CC BY): you may copy, share, adapt and reuse this content, also commercially, as long as you credit statistics.wiki and note any changes you made. The sources listed above may have their own license terms.