
Uruguay average age of mothers, 1960–2026
| Year | Age | World rank |
|---|---|---|
| At childbirth | ||
| 2026 projected | 29.5 | #79 |
| 2025 projected | 29.4 | #81 |
| 2024 | 29.3 | #82 |
| 2023 | 29.2 | #90 |
| 2022 | 29.2 | #91 |
| 2021 | 29.1 | #96 |
| 2020 | 28.9 | #105 |
| 2019 | 28.8 | #111 |
| 2018 | 28.6 | #122 |
| 2017 | 28.4 | #135 |
| 2016 | 28.2 | #139 |
| 2015 | 28.1 | #145 |
| 2014 | 27.9 | #150 |
| 2013 | 27.8 | #153 |
| 2012 | 27.7 | #151 |
| 2011 | 27.7 | #150 |
| 2010 | 27.7 | #150 |
| 2009 | 27.7 | #149 |
| 2008 | 27.7 | #149 |
| 2007 | 27.7 | #150 |
| 2006 | 27.7 | #149 |
| 2005 | 27.6 | #148 |
| 2004 | 27.6 | #147 |
| 2003 | 27.5 | #149 |
| 2002 | 27.4 | #148 |
| 2001 | 27.4 | #150 |
| 2000 | 27.5 | #142 |
| 1999 | 27.5 | #143 |
| 1998 | 27.6 | #138 |
| 1997 | 27.6 | #135 |
| 1996 | 27.6 | #134 |
| 1995 | 27.6 | #135 |
| 1994 | 27.5 | #135 |
| 1993 | 27.5 | #135 |
| 1992 | 27.5 | #133 |
| 1991 | 27.6 | #132 |
| 1990 | 27.6 | #132 |
| 1989 | 27.6 | #132 |
| 1988 | 27.6 | #131 |
| 1987 | 27.7 | #128 |
| 1986 | 27.8 | #126 |
| 1985 | 27.8 | #127 |
| 1984 | 27.7 | #131 |
| 1983 | 27.5 | #135 |
| 1982 | 27.5 | #136 |
| 1981 | 27.5 | #139 |
| 1980 | 27.5 | #140 |
| 1979 | 27.5 | #141 |
| 1978 | 27.6 | #139 |
| 1977 | 27.5 | #140 |
| 1976 | 27.7 | #139 |
| 1975 | 27.5 | #143 |
| 1974 | 27.4 | #152 |
| 1973 | 27.5 | #153 |
| 1972 | 27.4 | #157 |
| 1971 | 27.5 | #156 |
| 1970 | 27.6 | #158 |
| 1969 | 27.7 | #157 |
| 1968 | 27.7 | #157 |
| 1967 | 27.7 | #162 |
| 1966 | 27.7 | #162 |
| 1965 | 27.7 | #166 |
| 1964 | 27.7 | #167 |
| 1963 | 27.7 | #169 |
| 1962 | 27.7 | #168 |
| 1961 | 27.7 | #169 |
| 1960 | 27.7 | #172 |
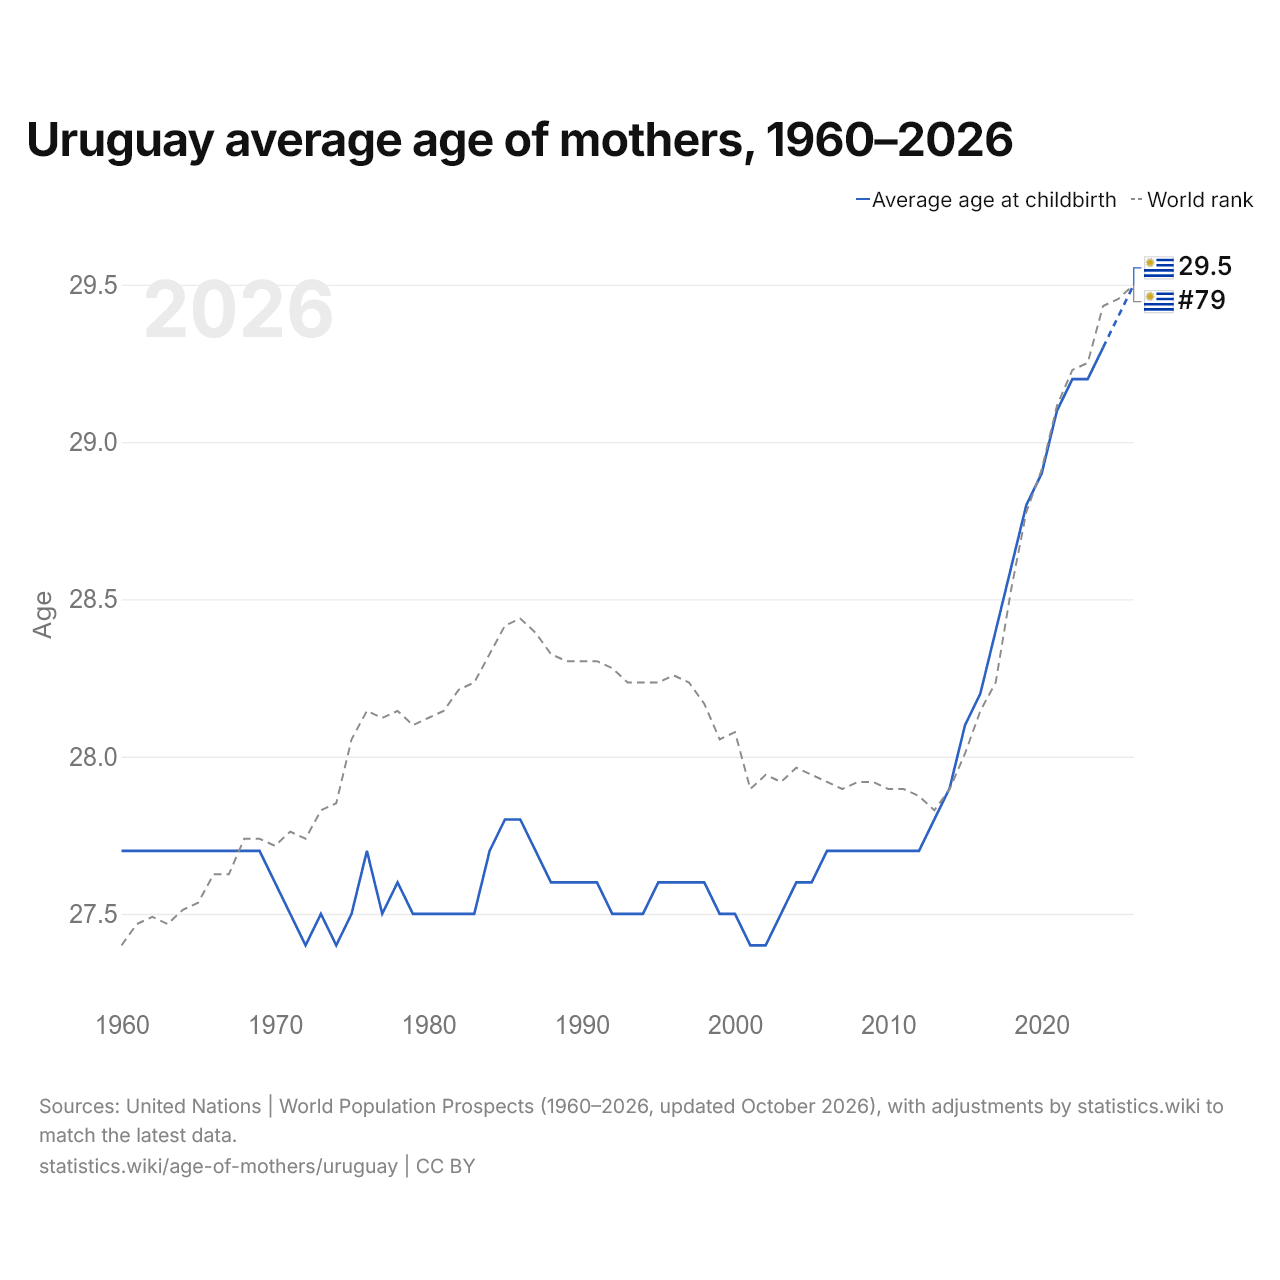
In 2026, Uruguay's average age of mothers at childbirth is 29.5 years, up from 27.7 in 1960. It was lowest in 2001, at 27.4. It is the 79th highest in the world, up from 81st in 2025.
Uruguay's average age of mothers at childbirth is the 5th highest of the 35 countries of Latin America, where it ranges from Nicaragua's 26.0 to Chile's 31.7. The largest ten-year rise in Uruguay's average age of mothers was from 2010 to 2020, by 1.2 years.
Uruguay births by age of the mother, 1960–2026
| Year | Share of births | ||
|---|---|---|---|
| Aged 15–19 | Aged 20–29 | Aged 30+ | |
| 2026 projected | 8% | 43.8% | 48.2% |
| 2025 projected | 8.3% | 44.5% | 47.2% |
| 2024 | 8.7% | 45.2% | 46.1% |
| 2023 | 9% | 45.8% | 45.1% |
| 2022 | 9.1% | 46.1% | 44.8% |
| 2021 | 9.4% | 46.5% | 44.1% |
| 2020 | 9.9% | 47% | 43.1% |
| 2019 | 10.7% | 47.1% | 42.2% |
| 2018 | 11.5% | 47.2% | 41.2% |
| 2017 | 12.6% | 47.4% | 39.9% |
| 2016 | 13.6% | 47.3% | 39% |
| 2015 | 14.6% | 47.2% | 38.1% |
| 2014 | 15.5% | 46.7% | 37.7% |
| 2013 | 16.2% | 46.5% | 37.3% |
| 2012 | 16.4% | 46.3% | 37.3% |
| 2011 | 16.3% | 46.3% | 37.4% |
| 2010 | 16.2% | 46.3% | 37.5% |
| 2009 | 16.1% | 46.5% | 37.4% |
| 2008 | 16% | 46.8% | 37.2% |
| 2007 | 15.8% | 47.5% | 36.7% |
| 2006 | 15.6% | 48.3% | 36.1% |
| 2005 | 15.4% | 49.3% | 35.4% |
| 2004 | 15.1% | 50.2% | 34.7% |
| 2003 | 15.2% | 50.8% | 34% |
| 2002 | 15.7% | 51% | 33.3% |
| 2001 | 15.9% | 51.1% | 33% |
| 2000 | 15.8% | 49.9% | 34.4% |
| 1999 | 15.8% | 50.6% | 33.6% |
| 1998 | 15.1% | 51.1% | 33.8% |
| 1997 | 15.2% | 51.1% | 33.7% |
| 1996 | 15.5% | 51.1% | 33.5% |
| 1995 | 15.7% | 51.1% | 33.2% |
| 1994 | 15.7% | 51.3% | 33% |
| 1993 | 15.4% | 51.9% | 32.7% |
| 1992 | 15% | 52.4% | 32.6% |
| 1991 | 14.5% | 53.1% | 32.4% |
| 1990 | 14.1% | 53.7% | 32.2% |
| 1989 | 13.8% | 54.3% | 31.9% |
| 1988 | 13.6% | 54.7% | 31.7% |
| 1987 | 13% | 55.3% | 31.7% |
| 1986 | 12.5% | 55.9% | 31.6% |
| 1985 | 12.3% | 56.4% | 31.4% |
| 1984 | 12.6% | 56.8% | 30.6% |
| 1983 | 13.3% | 56.9% | 29.8% |
| 1982 | 13.6% | 56.8% | 29.6% |
| 1981 | 14% | 56.1% | 29.8% |
| 1980 | 14.3% | 55.4% | 30.3% |
| 1979 | 14.2% | 55.2% | 30.7% |
| 1978 | 14% | 55% | 31.1% |
| 1977 | 13.8% | 55.3% | 30.9% |
| 1976 | 13.4% | 55% | 31.6% |
| 1975 | 13.5% | 55.3% | 31.2% |
| 1974 | 13.2% | 56% | 30.8% |
| 1973 | 12.8% | 56.2% | 30.9% |
| 1972 | 12.9% | 56.3% | 30.8% |
| 1971 | 12.7% | 56.4% | 30.9% |
| 1970 | 12.4% | 55.8% | 31.9% |
| 1969 | 12% | 55.2% | 32.8% |
| 1968 | 11.8% | 55.3% | 32.9% |
| 1967 | 11.8% | 55.3% | 32.9% |
| 1966 | 11.8% | 55.2% | 32.9% |
| 1965 | 11.8% | 55.3% | 32.9% |
| 1964 | 11.8% | 55.5% | 32.7% |
| 1963 | 11.7% | 55.8% | 32.5% |
| 1962 | 11.7% | 56.2% | 32.2% |
| 1961 | 11.7% | 56.5% | 31.8% |
| 1960 | 11.7% | 56.9% | 31.4% |
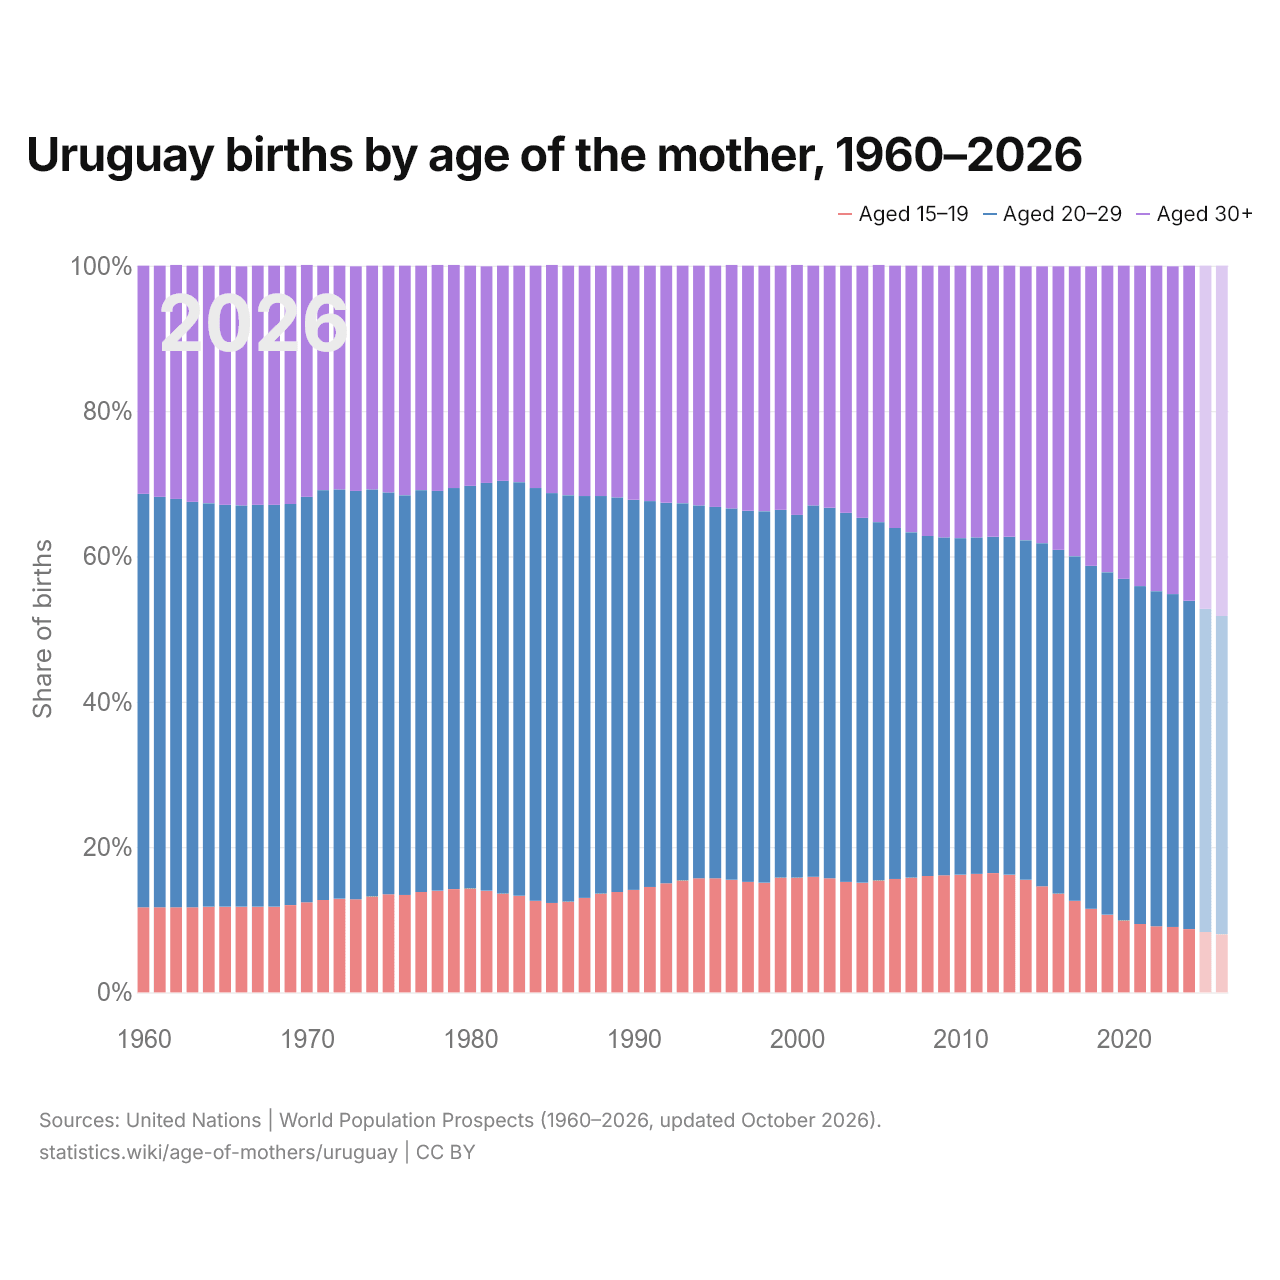
In 2026, 48.2% of births in Uruguay are to mothers aged 30 and over, 43.8% to mothers aged 20–29 and 8.0% to mothers aged 15–19. In 1960, the shares were 31.4%, 56.9% and 11.7%.
Uruguay in the world ranking by average age of mothers, 2026







Compare the average age of mothers in Uruguay with other countries
Sources:
- United Nations | World Population Prospects (1960–2026, updated October 2026), with adjustments by statistics.wiki to match the latest data
- United Nations Economic Commission for Europe (UNECE) (2021–2024, updated October 2026)
Creative Commons Attribution (CC BY): you may copy, share, adapt and reuse this content, also commercially, as long as you credit statistics.wiki and note any changes you made. The sources listed above may have their own license terms.