
Japan vs Belgium vaccination coverage (% of children aged 12–23 months)
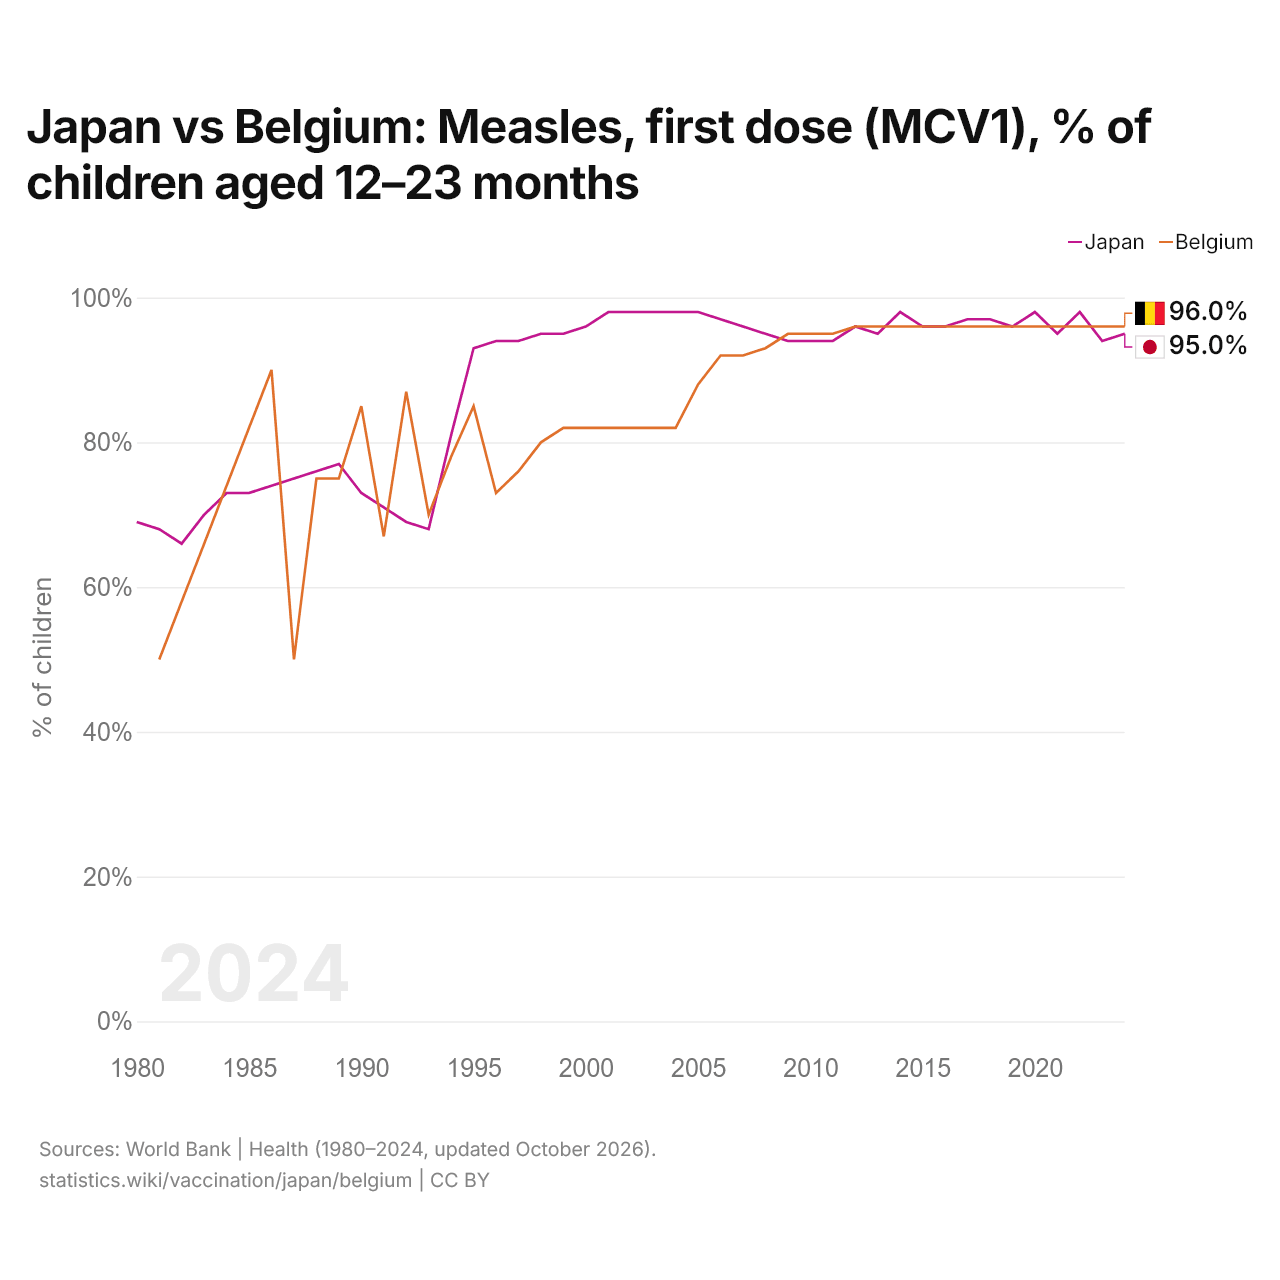
Measles, first dose (MCV1)
| Year | % of children | |
|---|---|---|
 Japan |
 Belgium |
|
| 2024 | 95% | 96% |
| 2023 | 94% | 96% |
| 2022 | 98% | 96% |
| 2021 | 95% | 96% |
| 2020 | 98% | 96% |
| 2019 | 96% | 96% |
| 2018 | 97% | 96% |
| 2017 | 97% | 96% |
| 2016 | 96% | 96% |
| 2015 | 96% | 96% |
| 2014 | 98% | 96% |
| 2013 | 95% | 96% |
| 2012 | 96% | 96% |
| 2011 | 94% | 95% |
| 2010 | 94% | 95% |
| 2009 | 94% | 95% |
| 2008 | 95% | 93% |
| 2007 | 96% | 92% |
| 2006 | 97% | 92% |
| 2005 | 98% | 88% |
| 2004 | 98% | 82% |
| 2003 | 98% | 82% |
| 2002 | 98% | 82% |
| 2001 | 98% | 82% |
| 2000 | 96% | 82% |
| 1999 | 95% | 82% |
| 1998 | 95% | 80% |
| 1997 | 94% | 76% |
| 1996 | 94% | 73% |
| 1995 | 93% | 85% |
| 1994 | 81% | 78% |
| 1993 | 68% | 70% |
| 1992 | 69% | 87% |
| 1991 | 71% | 67% |
| 1990 | 73% | 85% |
| 1989 | 77% | 75% |
| 1988 | 76% | 75% |
| 1987 | 75% | 50% |
| 1986 | 74% | 90% |
| 1985 | 73% | 82% |
| 1984 | 73% | 74% |
| 1983 | 70% | 66% |
| 1982 | 66% | 58% |
| 1981 | 68% | 50% |
| 1980 | 69% | - |
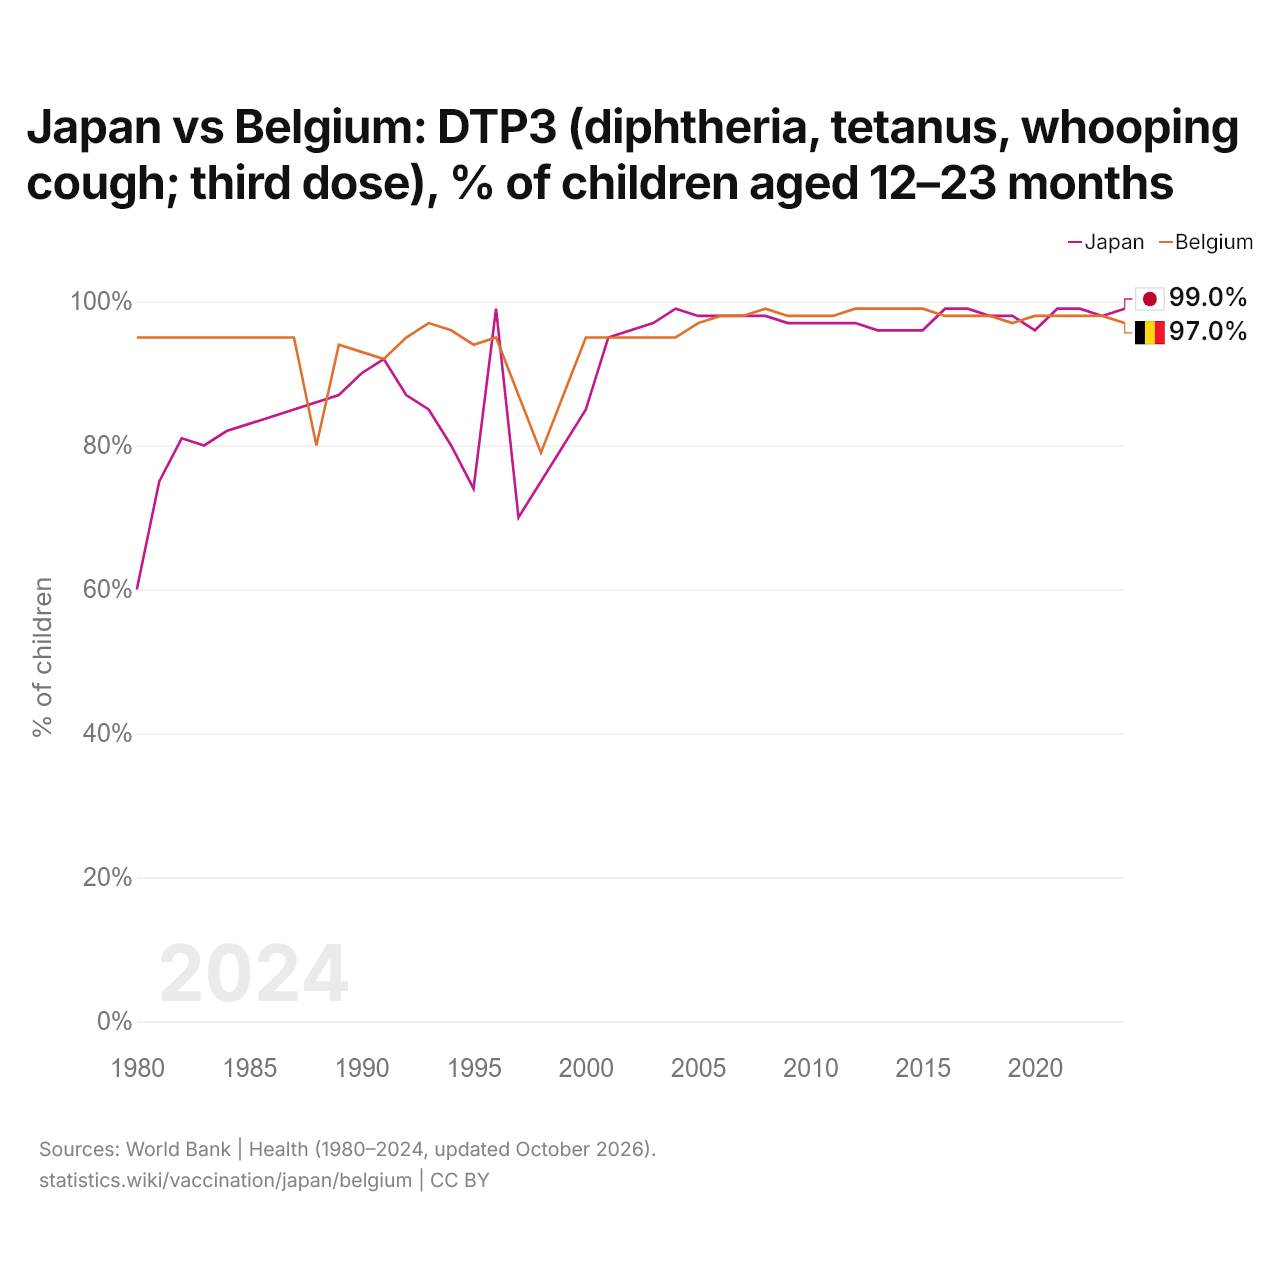
DTP3 (diphtheria, tetanus, whooping cough; third dose)
| Year | % of children | |
|---|---|---|
|
Japan
|
Belgium
|
|
| 2024 | 99% | 97% |
| 2023 | 98% | 98% |
| 2022 | 99% | 98% |
| 2021 | 99% | 98% |
| 2020 | 96% | 98% |
| 2019 | 98% | 97% |
| 2018 | 98% | 98% |
| 2017 | 99% | 98% |
| 2016 | 99% | 98% |
| 2015 | 96% | 99% |
| 2014 | 96% | 99% |
| 2013 | 96% | 99% |
| 2012 | 97% | 99% |
| 2011 | 97% | 98% |
| 2010 | 97% | 98% |
| 2009 | 97% | 98% |
| 2008 | 98% | 99% |
| 2007 | 98% | 98% |
| 2006 | 98% | 98% |
| 2005 | 98% | 97% |
| 2004 | 99% | 95% |
| 2003 | 97% | 95% |
| 2002 | 96% | 95% |
| 2001 | 95% | 95% |
| 2000 | 85% | 95% |
| 1999 | 80% | 87% |
| 1998 | 75% | 79% |
| 1997 | 70% | 87% |
| 1996 | 99% | 95% |
| 1995 | 74% | 94% |
| 1994 | 80% | 96% |
| 1993 | 85% | 97% |
| 1992 | 87% | 95% |
| 1991 | 92% | 92% |
| 1990 | 90% | 93% |
| 1989 | 87% | 94% |
| 1988 | 86% | 80% |
| 1987 | 85% | 95% |
| 1986 | 84% | 95% |
| 1985 | 83% | 95% |
| 1984 | 82% | 95% |
| 1983 | 80% | 95% |
| 1982 | 81% | 95% |
| 1981 | 75% | 95% |
| 1980 | 60% | 95% |
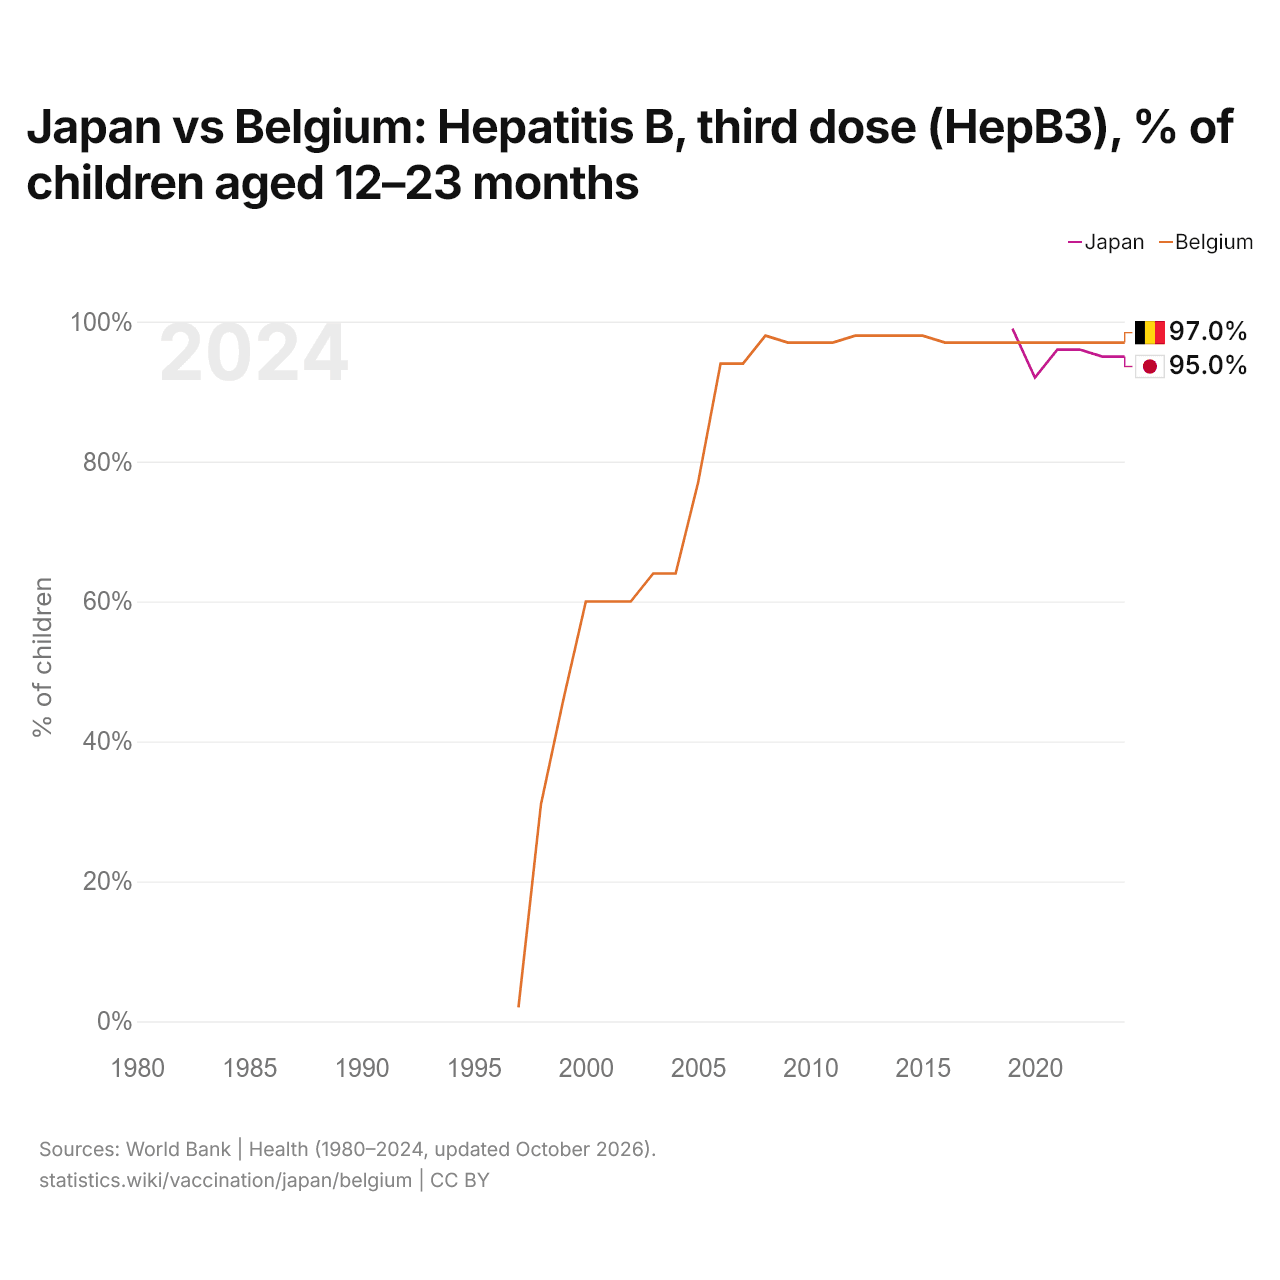
Hepatitis B, third dose (HepB3)
| Year | % of children | |
|---|---|---|
|
Japan
|
Belgium
|
|
| 2024 | 95% | 97% |
| 2023 | 95% | 97% |
| 2022 | 96% | 97% |
| 2021 | 96% | 97% |
| 2020 | 92% | 97% |
| 2019 | 99% | 97% |
| 2018 | - | 97% |
| 2017 | - | 97% |
| 2016 | - | 97% |
| 2015 | - | 98% |
| 2014 | - | 98% |
| 2013 | - | 98% |
| 2012 | - | 98% |
| 2011 | - | 97% |
| 2010 | - | 97% |
| 2009 | - | 97% |
| 2008 | - | 98% |
| 2007 | - | 94% |
| 2006 | - | 94% |
| 2005 | - | 77% |
| 2004 | - | 64% |
| 2003 | - | 64% |
| 2002 | - | 60% |
| 2001 | - | 60% |
| 2000 | - | 60% |
| 1999 | - | 46% |
| 1998 | - | 31% |
| 1997 | - | 2% |
| 1996 | - | - |
| 1995 | - | - |
| 1994 | - | - |
| 1993 | - | - |
| 1992 | - | - |
| 1991 | - | - |
| 1990 | - | - |
| 1989 | - | - |
| 1988 | - | - |
| 1987 | - | - |
| 1986 | - | - |
| 1985 | - | - |
| 1984 | - | - |
| 1983 | - | - |
| 1982 | - | - |
| 1981 | - | - |
| 1980 | - | - |
The first measles dose reaches 95% of children aged 12–23 months in Japan and 96% in Belgium: 1 percentage point more in Belgium. The third DTP dose reaches 99% in Japan and 97% in Belgium, 2 points more in Japan. The third hepatitis B dose reaches 95% in Japan and 97% in Belgium, 2 points more in Belgium. In 1981, the first measles dose reached 68% in Japan and 50% in Belgium, 18 percentage points more in Japan.
Japan vs Belgium: latest vaccination coverage (% of children aged 12–23 months)
|
Japan
|
Belgium
|
|
|---|---|---|
| Measles (MCV1) | 95% (2024) | 96% (2024) |
| DTP3 | 99% (2024) | 97% (2024) |
| HepB3 | 95% (2024) | 97% (2024) |
Japan and nearby countries: measles vaccination (MCV1), % of children aged 12–23 months





Belgium and its neighbors: measles vaccination (MCV1), % of children aged 12–23 months




Of Japan and the five nearby countries, the latest coverage of the first measles dose is highest in North Korea, at 99%, and lowest in the Philippines, at 80%; of Belgium and its four neighbors, the latest coverage of the first measles dose is highest in Luxembourg, at 99%, and lowest in the Netherlands, at 89%.
Compare the vaccination rates of any 2 countries
Sources:
- World Bank | Health (1980–2024, updated October 2026)
Creative Commons Attribution (CC BY): you may copy, share, adapt and reuse this content, also commercially, as long as you credit statistics.wiki and note any changes you made. The sources listed above may have their own license terms.