
Drag countries on the map to compare their true size
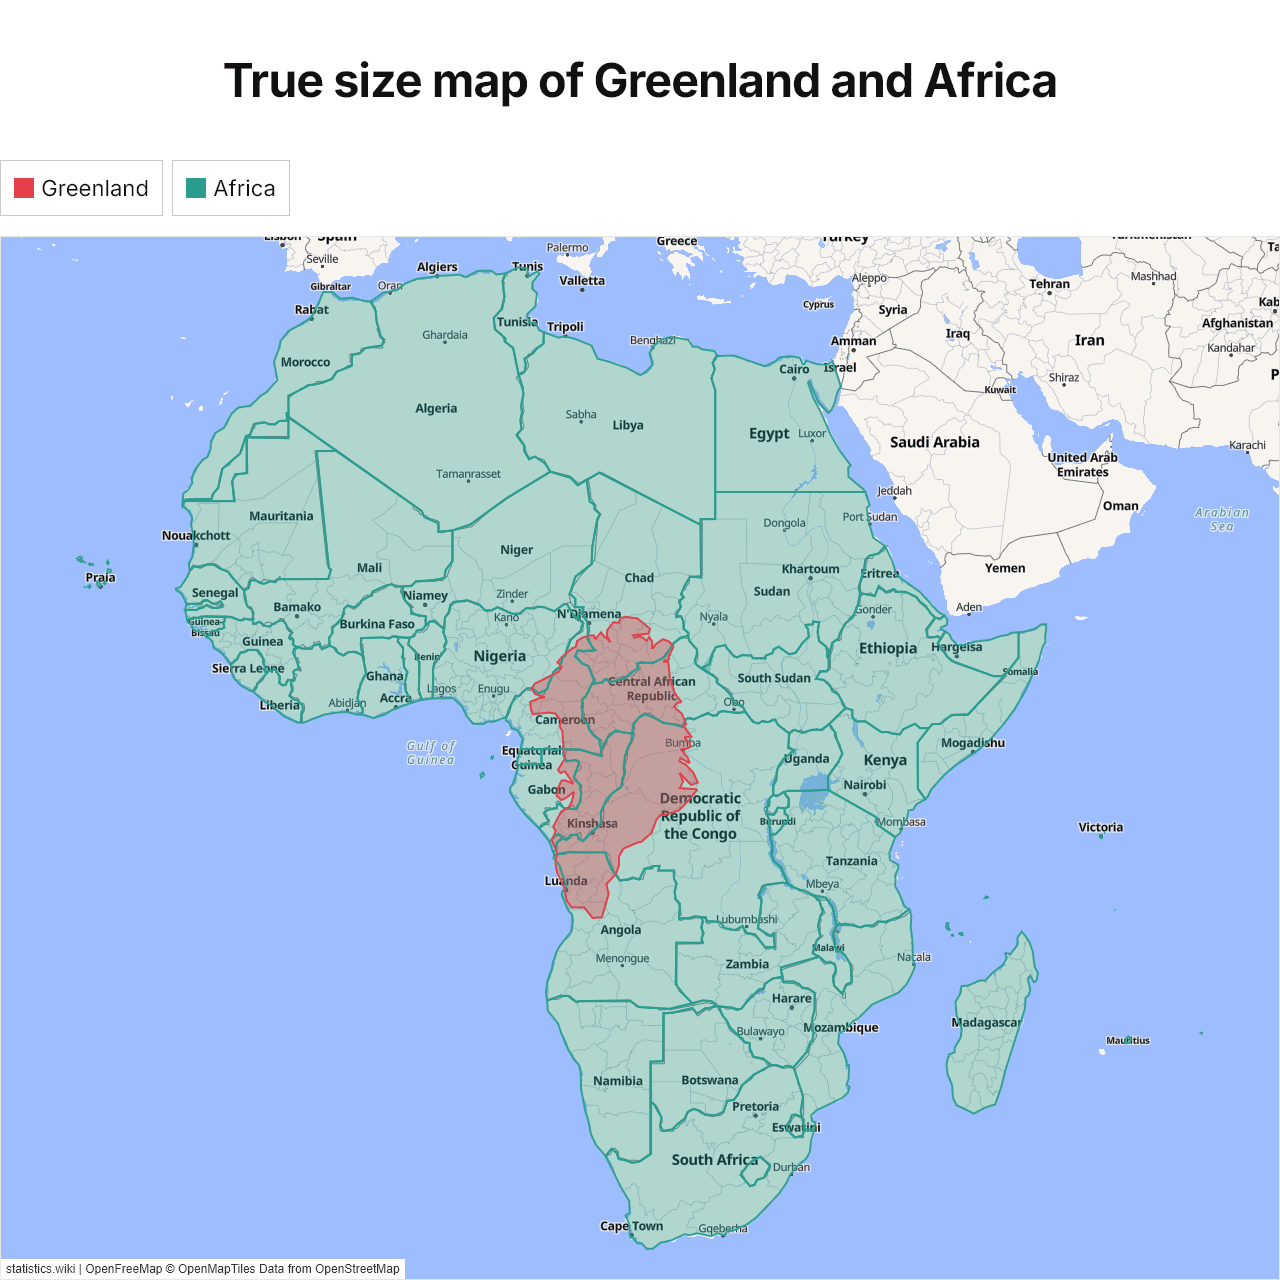
Of the ten largest countries, Canada looks the most enlarged on a Mercator map, 5.2 times its true size, and Brazil the least, 1.1 times. Canada's true total area, 3,855,103 mi² (9,984,670 km²), is 1.2 times Brazil's, 3,287,956 mi² (8,515,767 km²); on a Mercator map, Canada looks 5.8 times as large as Brazil.
How much bigger countries look on a Mercator map
| Rank | Country | Size on a Mercator map | True total area, mi² |
|---|---|---|---|
| 1 |
 Norway |
9.4× | 148,729 |
| 2 |
 Iceland |
5.6× | 39,770 |
| 3 |
 Finland |
5.5× | 130,687 |
| 4 |
 Canada |
5.2× | 3,855,103 |
| 5 |
 Russia |
4.9× | 6,592,849 |
| 6 |
 Sweden |
4.9× | 172,752 |
| 7 |
 Estonia |
3.7× | 17,504 |
| 8 |
 Latvia |
3.3× | 24,940 |
| 9 |
 Denmark |
3.2× | 16,574 |
| 10 |
 Lithuania |
3.1× | 25,212 |
| 11 |
 United Kingdom |
2.9× | 93,628 |
| 12 |
 Belarus |
2.8× | 80,154 |
| 13 |
 Ireland |
2.8× | 26,949 |
| 14 |
 Netherlands |
2.7× | 14,432 |
| 15 |
 Poland |
2.7× | 120,728 |
| 16 |
 Germany |
2.5× | 138,065 |
| 17 |
 Belgium |
2.5× | 11,849 |
| 18 |
 Czech Republic |
2.4× | 30,452 |
| 19 |
 Luxembourg |
2.4× | 1,001 |
| 20 |
 Ukraine |
2.3× | 233,032 |
| 21 |
 Slovakia |
2.3× | 18,932 |
| 22 |
 United States |
2.3× | 3,794,100 |
| 23 |
 Kazakhstan |
2.3× | 1,052,090 |
| 24 |
 Austria |
2.2× | 32,386 |
| 25 |
 Moldova |
2.2× | 13,067 |
| 26 |
 Hungary |
2.2× | 35,912 |
| 27 |
 Liechtenstein |
2.2× | 61.8 |
| 28 |
 Mongolia |
2.1× | 603,909 |
| 29 |
 Switzerland |
2.1× | 15,943 |
| 30 |
 Slovenia |
2.1× | 7,827 |
| 31 |
 Romania |
2.1× | 92,046 |
| 32 |
 Croatia |
2× | 21,851 |
| 33 |
 France |
2× | 248,573 |
| 34 |
 Serbia |
1.9× | 34,170 |
| 35 |
 Bosnia |
1.9× | 19,772 |
| 36 |
 San Marino |
1.9× | 23.6 |
| 37 |
 Monaco |
1.9× | 0.8 |
| 38 |
 Italy |
1.9× | 116,629 |
| 39 |
 Montenegro |
1.9× | 5,360 |
| 40 |
 Bulgaria |
1.9× | 42,855 |
| 41 |
 Andorra |
1.8× | 180.7 |
| 42 |
 Georgia |
1.8× | 26,911 |
| 43 |
 Vatican |
1.8× | 0.17 |
| 44 |
 New Zealand |
1.8× | 103,483 |
| 45 |
 Uzbekistan |
1.8× | 173,351 |
| 46 |
 North Macedonia |
1.8× | 9,928 |
| 47 |
 Kyrgyzstan |
1.8× | 77,202 |
| 48 |
 Chile |
1.8× | 291,933 |
| 49 |
 Albania |
1.8× | 11,100 |
| 50 |
 Spain |
1.7× | 195,364 |
| 51 |
 Azerbaijan |
1.7× | 33,436 |
| 52 |
 Armenia |
1.7× | 11,484 |
| 53 |
 North Korea |
1.7× | 46,541 |
| 54 |
 Portugal |
1.7× | 35,608 |
| 55 |
 Turkmenistan |
1.7× | 189,657 |
| 56 |
 Greece |
1.7× | 50,949 |
| 57 |
 Turkey |
1.7× | 302,535 |
| 58 |
 Tajikistan |
1.6× | 55,251 |
| 59 |
 Japan |
1.6× | 145,936 |
| 60 |
 China |
1.6× | 3,705,407 |
| 61 |
 Argentina |
1.6× | 1,073,518 |
| 62 |
 South Korea |
1.5× | 38,724 |
| 63 |
 Malta |
1.5× | 122 |
| 64 |
 Syria |
1.5× | 71,498 |
| 65 |
 Cyprus |
1.5× | 3,569 |
| 66 |
 Tunisia |
1.5× | 63,170 |
| 67 |
 Lebanon |
1.5× | 4,036 |
| 68 |
 Afghanistan |
1.5× | 251,827 |
| 69 |
 Iraq |
1.4× | 168,754 |
| 70 |
 Uruguay |
1.4× | 68,037 |
| 71 |
 Iran |
1.4× | 636,372 |
| 72 |
 Palestine |
1.4× | 2,326 |
| 73 |
 Israel |
1.4× | 8,521 |
| 74 |
 Jordan |
1.4× | 34,495 |
| 75 |
 Pakistan |
1.3× | 340,509 |
| 76 |
 Morocco |
1.3× | 172,414 |
| 77 |
 Lesotho |
1.3× | 11,722 |
| 78 |
 Kuwait |
1.3× | 6,880 |
| 79 |
 South Africa |
1.3× | 471,445 |
| 80 |
 Algeria |
1.3× | 919,595 |
| 81 |
 Nepal |
1.3× | 56,827 |
| 82 |
 Bhutan |
1.3× | 14,824 |
| 83 |
 Libya |
1.3× | 679,363 |
| 84 |
 Egypt |
1.3× | 390,121 |
| 85 |
 Australia |
1.3× | 2,969,907 |
| 86 |
 Eswatini |
1.2× | 6,704 |
| 87 |
 Bahrain |
1.2× | 309 |
| 88 |
 Bahamas |
1.2× | 5,358 |
| 89 |
 Qatar |
1.2× | 4,493 |
| 90 |
 Saudi Arabia |
1.2× | 868,730 |
| 91 |
 Mexico |
1.2× | 761,606 |
| 92 |
 UAE |
1.2× | 32,278 |
| 93 |
 Bangladesh |
1.2× | 56,977 |
| 94 |
 Taiwan |
1.2× | 13,976 |
| 95 |
 India |
1.2× | 1,269,219 |
| 96 |
 Paraguay |
1.2× | 157,049 |
| 97 |
 Namibia |
1.2× | 318,772 |
| 98 |
 Botswana |
1.2× | 224,610 |
| 99 |
 Cuba |
1.2× | 42,426 |
| 100 |
 Myanmar |
1.2× | 261,228 |
| 101 |
 Oman |
1.1× | 119,499 |
| 102 |
 Mauritania |
1.1× | 397,955 |
| 103 |
 Mauritius |
1.1× | 788 |
| 104 |
 Tonga |
1.1× | 289 |
| 105 |
 Madagascar |
1.1× | 226,756 |
| 106 |
 Cayman Islands |
1.1× | 101.9 |
| 107 |
 Zimbabwe |
1.1× | 150,872 |
| 108 |
 Haiti |
1.1× | 10,714 |
| 109 |
 Dominican Republic |
1.1× | 18,792 |
| 110 |
 Laos |
1.1× | 91,429 |
| 111 |
 Jamaica |
1.1× | 4,244 |
| 112 |
 Mozambique |
1.1× | 309,496 |
| 113 |
 Mali |
1.1× | 478,841 |
| 114 |
 Niger |
1.1× | 489,191 |
| 115 |
 Fiji |
1.1× | 7,078 |
| 116 |
 Vietnam |
1.1× | 128,066 |
| 117 |
 Antigua |
1.1× | 170 |
| 118 |
 Saint Kitts |
1.1× | 104 |
| 119 |
 Belize |
1.1× | 8,867 |
| 120 |
 Bolivia |
1.1× | 424,164 |
| 121 |
 Sudan |
1.1× | 725,100 |
| 122 |
 Yemen |
1.1× | 203,850 |
| 123 |
 Cape Verde |
1.1× | 1,557 |
| 124 |
 Chad |
1.1× | 495,755 |
| 125 |
 Guatemala |
1.1× | 42,042 |
| 126 |
 Vanuatu |
1.1× | 4,707 |
| 127 |
 Eritrea |
1.1× | 46,962 |
| 128 |
 Dominica |
1.1× | 290 |
| 129 |
 Thailand |
1.1× | 198,117 |
| 130 |
 Honduras |
1.1× | 43,433 |
| 131 |
 Senegal |
1.1× | 75,955 |
| 132 |
 Saint Lucia |
1.1× | 238.2 |
| 133 |
 Samoa |
1.1× | 1,097 |
| 134 |
 El Salvador |
1.1× | 8,124 |
| 135 |
 Zambia |
1.1× | 290,587 |
| 136 |
 Brazil |
1.1× | 3,287,956 |
| 137 |
 Gambia |
1.1× | 4,363 |
| 138 |
 Malawi |
1.1× | 45,747 |
| 139 |
 Saint Vincent |
1.1× | 150.2 |
| 140 |
 Barbados |
1.1× | 169.5 |
| 141 |
 Nicaragua |
1.1× | 46,464 |
| 142 |
 Cambodia |
1.1× | 69,898 |
| 143 |
 Angola |
1.1× | 481,354 |
| 144 |
 Burkina Faso |
1× | 105,869 |
| 145 |
 Philippines |
1× | 132,606 |
| 146 |
 Curacao |
1× | 171.4 |
| 147 |
 Grenada |
1× | 134.6 |
| 148 |
 Guinea-Bissau |
1× | 13,948 |
| 149 |
 Comoros |
1× | 785 |
| 150 |
 Djibouti |
1× | 8,958 |
| 151 |
 Guinea |
1× | 94,926 |
| 152 |
 Trinidad |
1× | 1,980 |
| 153 |
 Peru |
1× | 496,225 |
| 154 |
 Costa Rica |
1× | 19,761 |
| 155 |
 Nigeria |
1× | 356,669 |
| 156 |
 Benin |
1× | 44,310 |
| 157 |
 Ethiopia |
1× | 436,225 |
| 158 |
 Solomon Islands |
1× | 10,965 |
| 159 |
 East Timor |
1× | 5,760 |
| 160 |
 Sierra Leone |
1× | 27,915 |
| 161 |
 Panama |
1× | 29,081 |
| 162 |
 Togo |
1× | 21,925 |
| 163 |
 Ghana |
1× | 92,099 |
| 164 |
 Tuvalu |
1× | 10 |
| 165 |
 Sri Lanka |
1× | 25,332 |
| 166 |
 Ivory Coast |
1× | 124,504 |
| 167 |
 Venezuela |
1× | 352,144 |
| 168 |
 South Sudan |
1× | 248,777 |
| 169 |
 Marshall Islands |
1× | 70.1 |
| 170 |
 Palau |
1× | 179.7 |
| 171 |
 Seychelles |
1× | 177.2 |
| 172 |
 Tanzania |
1× | 365,756 |
| 173 |
 CAR |
1× | 240,535 |
| 174 |
 Papua New Guinea |
1× | 178,704 |
| 175 |
 Liberia |
1× | 43,000 |
| 176 |
 Cameroon |
1× | 183,569 |
| 177 |
 Somalia |
1× | 246,201 |
| 178 |
 DR Congo |
1× | 905,355 |
| 179 |
 Colombia |
1× | 440,831 |
| 180 |
 Guyana |
1× | 83,000 |
| 181 |
 Brunei |
1× | 2,226 |
| 182 |
 Maldives |
1× | 115.1 |
| 183 |
 Suriname |
1× | 63,039 |
| 184 |
 Malaysia |
1× | 127,724 |
| 185 |
 Indonesia |
1× | 735,359 |
| 186 |
 Burundi |
1× | 10,747 |
| 187 |
 Kiribati |
1× | 313 |
| 188 |
 Congo |
1× | 132,047 |
| 189 |
 Kenya |
1× | 224,445 |
| 190 |
 Rwanda |
1× | 10,169 |
| 191 |
 Ecuador |
1× | 99,307 |
| 192 |
 Uganda |
1× | 93,065 |
| 193 |
 Equatorial Guinea |
1× | 10,831 |
| 194 |
 Gabon |
1× | 103,347 |
| 195 |
 Singapore |
1× | 284 |
| 196 |
 Sao Tome |
1× | 386 |
| 197 |
 Nauru |
1× | 8.19 |
Of the 197 countries, Norway looks the most enlarged on a Mercator map, 9.4 times its true size, followed by Iceland, 5.6 times, and Finland, 5.5 times. Nauru, the least enlarged, looks about its true size.
The Mercator projection, which most web maps use, keeps the shapes of small areas but enlarges them more the farther they are from the equator: at 60° north or south an area looks four times its true size, and the poles can't be shown at all. The enlargement here is the area of a country's shape on a Mercator map divided by its true area, both computed from the country shapes the true size map draws, with the map cut at 85° north and south as on web maps.
Compare the true size of any 2 countries
Sources:
- World Bank | Agriculture & Rural Development (2026, updated October 2026)
- National Statistics, Taiwan (2026, updated October 2026)
Creative Commons Attribution (CC BY): you may copy, share, adapt and reuse this content, also commercially, as long as you credit statistics.wiki and note any changes you made. The sources listed above may have their own license terms.