
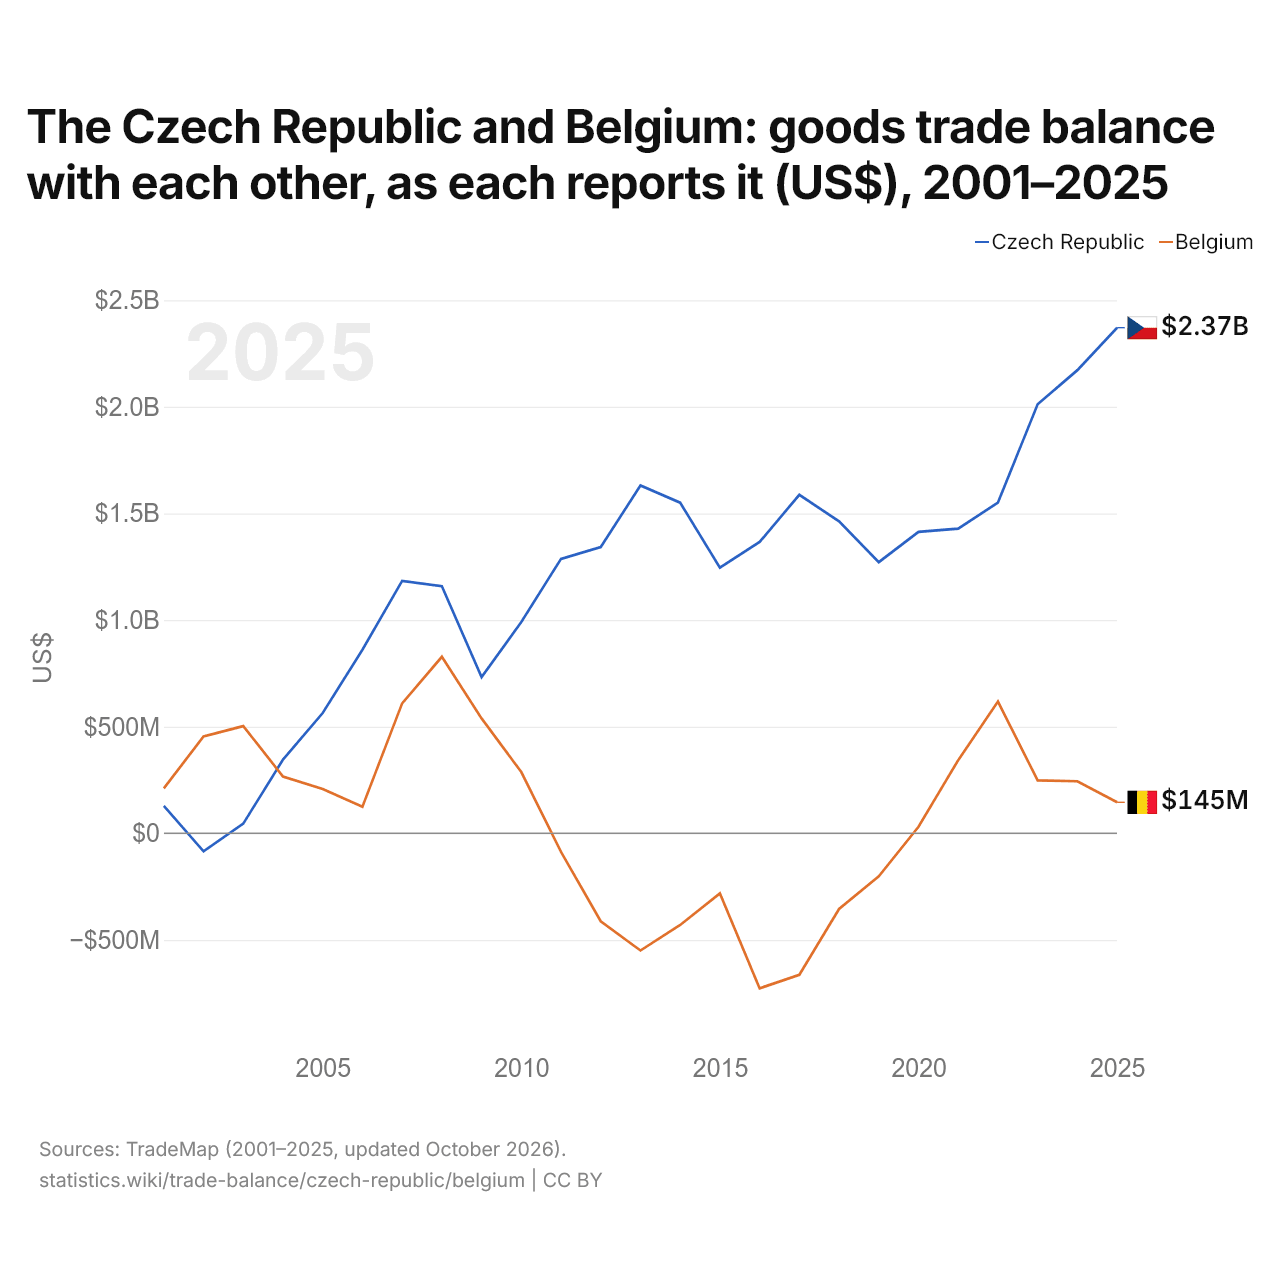
The Czech Republic and Belgium: goods trade balance with each other, as each reports it (US$), 2001–2025
| Year | US$ | |
|---|---|---|
| Czech Republic | Belgium | |
| 2025 | $2,370,863,000 | $145,335,000 |
| 2024 | $2,171,780,000 | $243,904,000 |
| 2023 | $2,011,445,000 | $247,825,000 |
| 2022 | $1,550,796,000 | $617,636,000 |
| 2021 | $1,428,473,000 | $343,042,000 |
| 2020 | $1,413,323,000 | $30,577,000 |
| 2019 | $1,271,238,000 | $−201,595,000 |
| 2018 | $1,462,611,000 | $−354,693,000 |
| 2017 | $1,587,323,000 | $−663,678,000 |
| 2016 | $1,366,044,000 | $−726,908,000 |
| 2015 | $1,245,682,000 | $−282,100,000 |
| 2014 | $1,550,312,000 | $−429,909,000 |
| 2013 | $1,630,841,000 | $−549,710,000 |
| 2012 | $1,342,141,000 | $−412,430,000 |
| 2011 | $1,286,906,000 | $−87,218,000 |
| 2010 | $990,571,000 | $287,231,000 |
| 2009 | $732,167,000 | $538,564,000 |
| 2008 | $1,158,963,000 | $827,889,000 |
| 2007 | $1,183,592,000 | $609,272,000 |
| 2006 | $860,536,000 | $124,961,000 |
| 2005 | $563,943,000 | $207,636,000 |
| 2004 | $345,360,000 | $266,294,000 |
| 2003 | $45,259,000 | $502,666,000 |
| 2002 | $−84,643,000 | $454,431,000 |
| 2001 | $128,587,000 | $210,328,000 |
In 2025, as the Czech Republic reports it, its goods trade with Belgium had a surplus of $2.37 billion; as Belgium reports it, its goods trade with the Czech Republic had a surplus of $145 million. In 2001, the figures were a surplus of $129 million for the Czech Republic and a surplus of $210 million for Belgium.
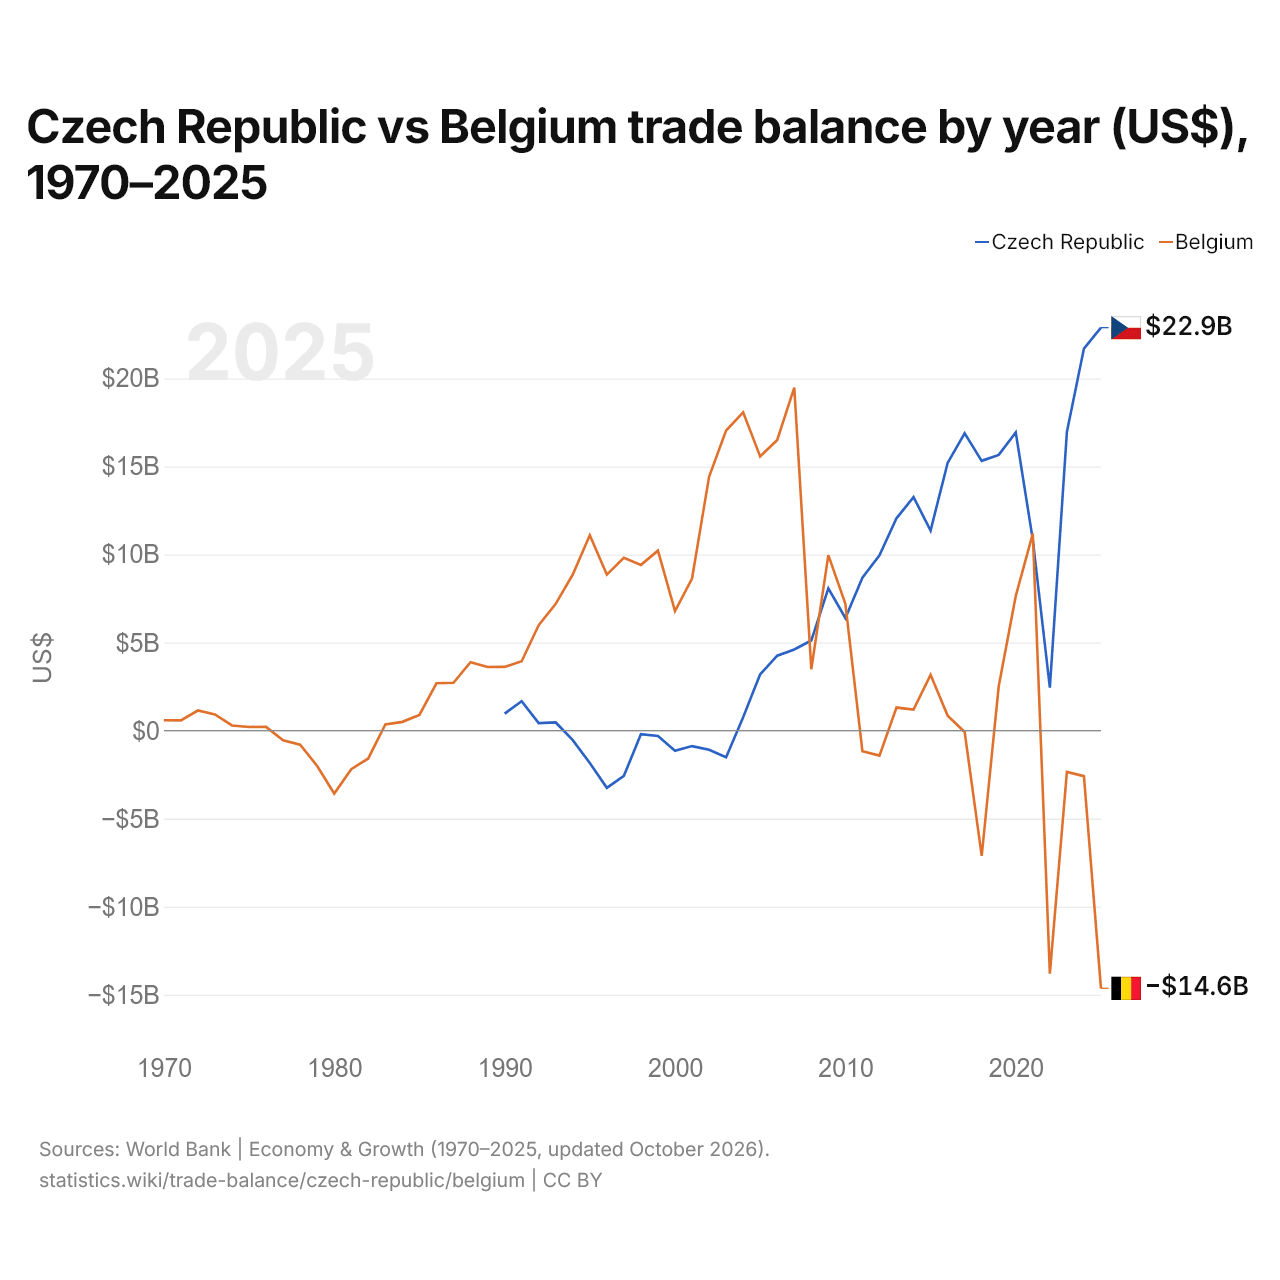
Czech Republic vs Belgium trade balance by year (US$), 1970–2025
| Year | US$ | |
|---|---|---|
 Czech Republic |
 Belgium |
|
| 2025 | $22,878,027,603 | $−14,637,349,567 |
| 2024 | $21,694,216,122 | $−2,589,378,795 |
| 2023 | $16,954,887,246 | $−2,348,299,205 |
| 2022 | $2,436,871,174 | $−13,809,679,840 |
| 2021 | $10,829,928,730 | $11,185,411,660 |
| 2020 | $16,928,598,356 | $7,646,774,510 |
| 2019 | $15,651,844,019 | $2,519,265,437 |
| 2018 | $15,315,705,306 | $−7,117,140,449 |
| 2017 | $16,878,780,533 | $−76,479,416 |
| 2016 | $15,198,251,494 | $846,891,572 |
| 2015 | $11,359,195,081 | $3,166,438,839 |
| 2014 | $13,259,881,970 | $1,191,266,653 |
| 2013 | $12,054,111,826 | $1,306,071,280 |
| 2012 | $9,948,972,034 | $−1,422,261,060 |
| 2011 | $8,679,572,971 | $−1,174,531,842 |
| 2010 | $6,391,475,659 | $7,194,531,778 |
| 2009 | $8,076,693,070 | $9,960,978,144 |
| 2008 | $5,117,123,661 | $3,480,542,817 |
| 2007 | $4,607,242,642 | $19,473,396,555 |
| 2006 | $4,254,235,338 | $16,503,842,056 |
| 2005 | $3,193,376,577 | $15,569,789,759 |
| 2004 | $750,900,785 | $18,069,920,173 |
| 2003 | $−1,518,806,055 | $17,041,157,540 |
| 2002 | $−1,090,242,100 | $14,411,205,478 |
| 2001 | $−881,119,580 | $8,634,316,460 |
| 2000 | $−1,152,699,149 | $6,783,287,644 |
| 1999 | $−311,896,139 | $10,216,533,029 |
| 1998 | $−208,976,122 | $9,409,313,181 |
| 1997 | $−2,574,782,483 | $9,815,741,994 |
| 1996 | $−3,255,603,201 | $8,856,286,645 |
| 1995 | $−1,843,896,006 | $11,089,490,969 |
| 1994 | $−543,925,829 | $8,858,973,957 |
| 1993 | $459,947,518 | $7,197,266,791 |
| 1992 | $419,451,291 | $5,983,582,183 |
| 1991 | $1,667,315,975 | $3,934,812,758 |
| 1990 | $956,409,792 | $3,612,875,423 |
| 1989 | - | $3,607,222,563 |
| 1988 | - | $3,884,174,438 |
| 1987 | - | $2,713,639,114 |
| 1986 | - | $2,687,310,818 |
| 1985 | - | $890,002,718 |
| 1984 | - | $495,069,813 |
| 1983 | - | $344,979,882 |
| 1982 | - | $−1,582,876,567 |
| 1981 | - | $−2,193,369,187 |
| 1980 | - | $−3,577,711,408 |
| 1979 | - | $−2,010,039,901 |
| 1978 | - | $−799,154,605 |
| 1977 | - | $−549,247,046 |
| 1976 | - | $208,368,861 |
| 1975 | - | $202,501,919 |
| 1974 | - | $288,928,128 |
| 1973 | - | $916,582,488 |
| 1972 | - | $1,138,651,819 |
| 1971 | - | $581,774,525 |
| 1970 | - | $583,597,418 |
In 2025, the Czech Republic had a trade surplus of $22.9 billion and Belgium a deficit of $14.6 billion. In 1990, the Czech Republic had a surplus of $956 million and Belgium a surplus of $3.61 billion.
From 1990 to 2025, the Czech Republic had a trade surplus in 26 of the 36 years and Belgium in 28. The Czech Republic and Belgium never both had a trade deficit in the same year.
Czech Republic vs Belgium: trade balance figures
|
Czech Republic
|
Belgium
|
|
|---|---|---|
| Goods and services, US$ | +$22.9B (2025) | −$14.6B (2025) |
| % of GDP | +5.9% (2025) | −2.0% (2025) |
| Years in surplus since 2000 | 22 of 26 | 18 of 26 |
| Goods balance with each other, own figures | +$2.37B (2025) | +$145M (2025) |
| Largest goods surplus with | Germany (+$38.5B, 2025) | Germany (+$42.1B, 2025) |
| Largest goods deficit with | China (−$37.2B, 2025) | Netherlands (−$33.2B, 2025) |
Compare the trade balance of any 2 countries
Sources:
- World Bank | Economy & Growth (1970–2025, updated October 2026)
- TradeMap (2001–2025, updated October 2026)
Creative Commons Attribution (CC BY): you may copy, share, adapt and reuse this content, also commercially, as long as you credit statistics.wiki and note any changes you made. The sources listed above may have their own license terms.