
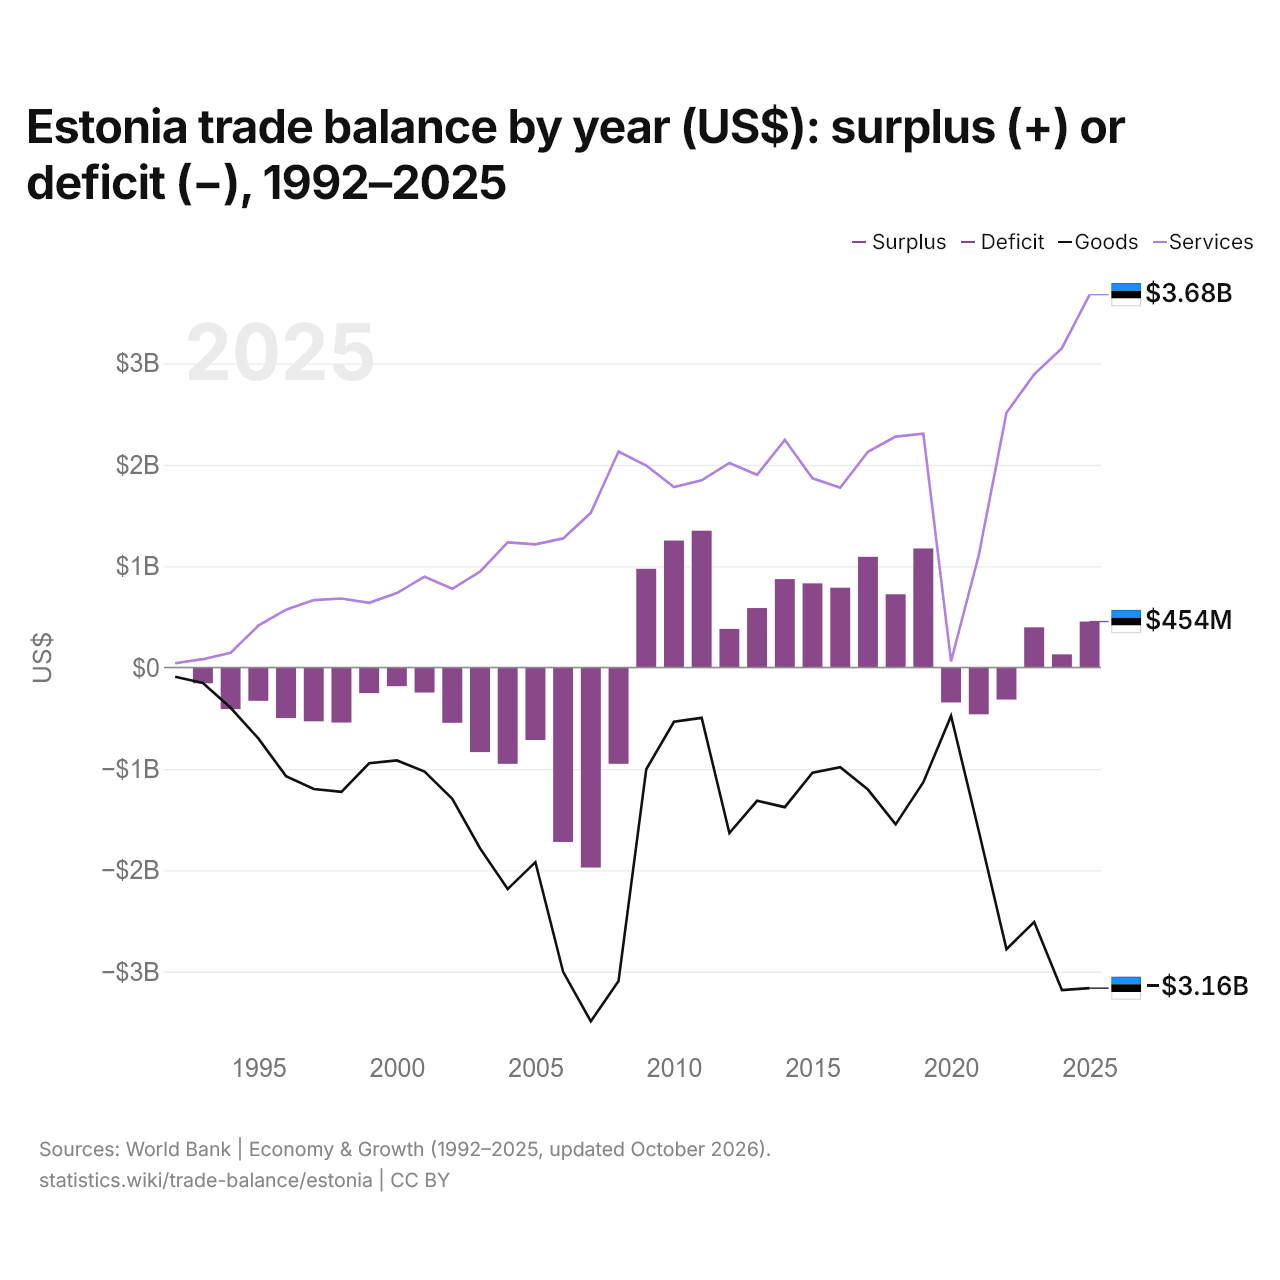
Estonia trade balance by year (US$): surplus (+) or deficit (−), 1992–2025
| Year | US$ | ||
|---|---|---|---|
| Goods and services | Goods | Services | |
| 2025 | $453,750,379 | $−3,163,690,720 | $3,679,118,442 |
| 2024 | $129,936,528 | $−3,182,310,028 | $3,151,155,986 |
| 2023 | $396,747,735 | $−2,510,179,459 | $2,892,891,339 |
| 2022 | $−316,227,347 | $−2,778,373,205 | $2,513,541,652 |
| 2021 | $−461,332,589 | $−1,613,300,252 | $1,107,625,377 |
| 2020 | $−344,789,028 | $−477,128,628 | $60,818,465 |
| 2019 | $1,174,917,604 | $−1,131,213,461 | $2,307,631,936 |
| 2018 | $723,042,941 | $−1,547,837,017 | $2,277,955,053 |
| 2017 | $1,092,039,070 | $−1,203,751,746 | $2,128,834,057 |
| 2016 | $787,792,908 | $−982,153,941 | $1,773,669,463 |
| 2015 | $830,312,848 | $−1,036,751,639 | $1,866,882,833 |
| 2014 | $872,688,180 | $−1,377,758,860 | $2,246,887,498 |
| 2013 | $587,050,751 | $−1,314,427,544 | $1,901,459,535 |
| 2012 | $381,119,712 | $−1,633,281,248 | $2,018,950,179 |
| 2011 | $1,350,033,737 | $−496,348,433 | $1,846,929,955 |
| 2010 | $1,253,486,958 | $−534,996,469 | $1,780,761,448 |
| 2009 | $974,584,607 | $−1,003,876,200 | $1,993,176,475 |
| 2008 | $−950,430,643 | $−3,092,333,260 | $2,131,697,037 |
| 2007 | $−1,973,380,783 | $−3,490,957,892 | $1,526,482,740 |
| 2006 | $−1,720,959,729 | $−3,002,365,135 | $1,274,069,299 |
| 2005 | $−715,041,661 | $−1,920,064,211 | $1,215,469,868 |
| 2004 | $−949,754,037 | $−2,185,435,620 | $1,235,735,536 |
| 2003 | $−834,581,075 | $−1,783,034,860 | $946,431,510 |
| 2002 | $−545,705,943 | $−1,294,916,854 | $776,379,337 |
| 2001 | $−247,250,022 | $−1,026,159,104 | $896,281,592 |
| 2000 | $−184,292,822 | $−916,314,506 | $734,514,765 |
| 1999 | $−252,396,721 | $−944,315,524 | $638,889,086 |
| 1998 | $−542,983,647 | $−1,226,562,926 | $680,814,234 |
| 1997 | $−530,215,284 | $−1,198,090,290 | $665,386,405 |
| 1996 | $−498,652,621 | $−1,071,447,680 | $570,894,529 |
| 1995 | $−328,031,471 | $−699,754,988 | $412,852,028 |
| 1994 | $−410,176,133 | $−396,513,348 | $145,174,640 |
| 1993 | $−155,419,423 | $−152,029,740 | $82,378,000 |
| 1992 | - | $−90,384,275 | $42,720,489 |
In 2025, Estonia had a trade surplus of $454 million, compared with a deficit of $155 million in 1993. The largest deficit was $1.97 billion, in 2007, and the largest surplus $1.35 billion, in 2011. Estonia's trade has been in surplus every year since 2023.
In 2025, Estonia's trade balance was the 23rd highest of 41 countries in Europe, where trade balances ranged from Ukraine's deficit of $56.8 billion to Ireland's surplus of $290 billion. From 2016 to 2025, Estonia's trade balances added up to a surplus of $3.64 billion, compared with a surplus of $1.6 billion from 2006 to 2015. In 2025, Estonia had a current account surplus of 0.4% of GDP.
Estonia goods trade with its 10 largest trading partners, as reported by Estonia, 2025
| Country | Exports to | Imports from | Balance | |
|---|---|---|---|---|
 Finland |
$3.15B | $1.84B | +$1.31B | vs Finland |
 Germany |
$1.58B | $2.52B | −$948M | |
 Latvia |
$2.35B | $1.57B | +$780M | vs Latvia |
 Lithuania |
$1.83B | $1.45B | +$377M | vs Lithuania |
 China |
$259M | $2.81B | −$2.55B | |
 Sweden |
$1.83B | $1.07B | +$761M | vs Sweden |
 Poland |
$884M | $1.36B | −$476M | vs Poland |
 Netherlands |
$777M | $1.13B | −$356M | |
 United States |
$656M | $862M | −$207M | vs US |
 Italy |
$355M | $871M | −$516M |
Estonia trade balance: surplus (+) or deficit (−)
Compare Estonia trade balance with other countries
Sources:
- TradeMap (2025, updated October 2026)
- World Bank | Economy & Growth (1992–2025, updated October 2026)
Creative Commons Attribution (CC BY): you may copy, share, adapt and reuse this content, also commercially, as long as you credit statistics.wiki and note any changes you made. The sources listed above may have their own license terms.