
Italy vs China international tourist arrivals (tourists or all visitors, as reported)
1x
| Year | Arrivals | |
|---|---|---|
 Italy |
 China |
|
| 2020 | 38,419,000 | 30,402,000 |
| 2019 | 95,399,000 | 162,538,000 |
| 2018 | 93,228,601 | 158,606,000 |
| 2017 | 89,931,000 | 153,260,000 |
| 2016 | 84,925,000 | 141,774,000 |
| 2015 | 81,068,000 | 133,820,000 |
| 2014 | 77,694,000 | 128,499,000 |
| 2013 | 76,762,000 | 129,078,000 |
| 2012 | 76,293,000 | 132,405,000 |
| 2011 | 75,866,000 | 135,423,000 |
| 2010 | 73,225,000 | 133,762,000 |
| 2009 | 71,692,000 | 126,476,000 |
| 2008 | 70,719,000 | 130,027,000 |
| 2007 | 70,271,000 | 131,873,000 |
| 2006 | 66,353,000 | 124,942,000 |
| 2005 | 59,230,000 | 120,292,000 |
| 2004 | 58,480,000 | 109,038,000 |
| 2003 | 63,026,000 | 91,662,000 |
| 2002 | 63,561,000 | 97,908,000 |
| 2001 | 60,960,000 | 89,013,000 |
| 2000 | 62,702,000 | 83,444,000 |
| 1999 | 59,521,000 | 72,796,000 |
| 1998 | 58,499,000 | 63,478,000 |
| 1997 | 57,998,000 | 57,588,000 |
| 1996 | 59,805,000 | 51,128,000 |
| 1995 | 55,706,000 | 46,387,000 |
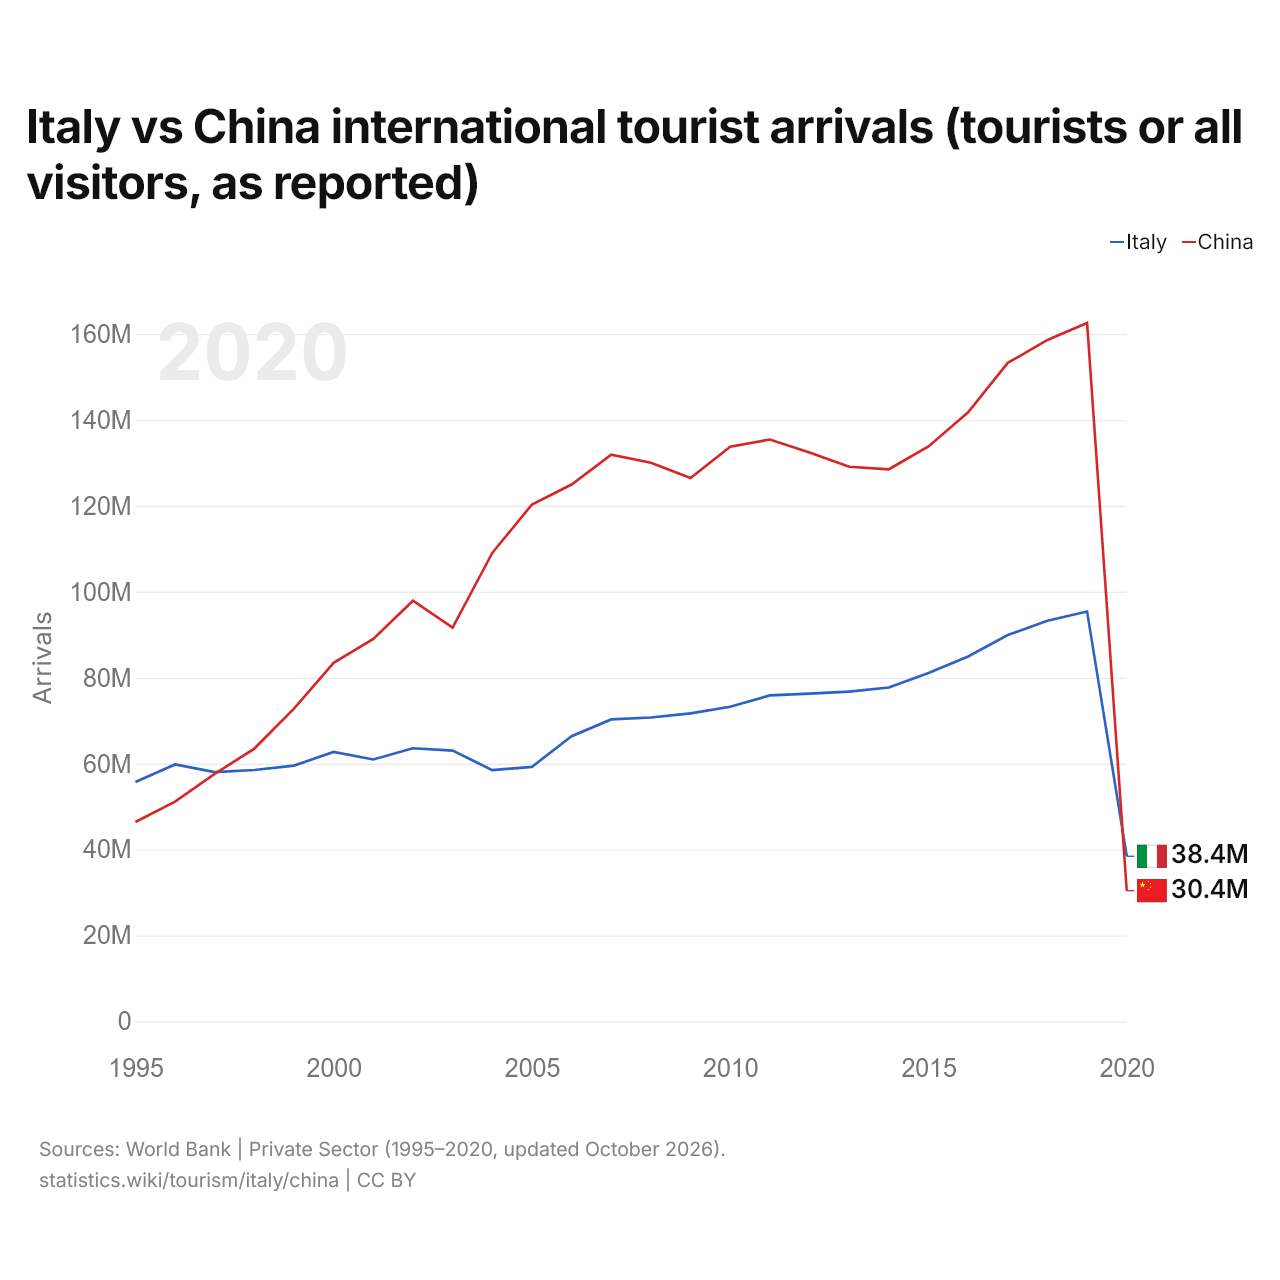
International arrivals number 38.4 million in Italy and 30.4 million in China: 26% more for Italy. In 1995, Italy recorded 20% more: 55.7 million for Italy and 46.4 million for China.
Italy records 60% fewer international arrivals than the year before, and China 81% fewer.
Italy vs China: international tourism figures
Compare the tourist arrivals of any 2 countries
Sources:
- World Bank | Private Sector (1995–2020, updated October 2026)
Creative Commons Attribution (CC BY): you may copy, share, adapt and reuse this content, also commercially, as long as you credit statistics.wiki and note any changes you made. The sources listed above may have their own license terms.