
Denmark international tourist arrivals (tourists or all visitors, as reported)
| Year | Arrivals | World rank |
|---|---|---|
| Arrivals | ||
| 2020 | 15,595,000 | - |
| 2019 | 33,093,000 | #16 |
| 2018 | 30,801,000 | #19 |
| 2017 | 30,736,000 | #16 |
| 2016 | 28,692,000 | #16 |
| 2015 | 28,209,000 | #16 |
| 2014 | 28,070,000 | #14 |
| 2013 | 26,516,000 | #15 |
| 2012 | 26,402,000 | #14 |
| 2011 | 25,811,000 | #13 |
| 2010 | 26,730,000 | #13 |
| 2009 | 26,571,000 | #12 |
| 2008 | 26,870,000 | #14 |
| 2007 | 27,138,000 | #13 |
| 2006 | 26,936,000 | #12 |
| 2005 | 26,927,000 | #12 |
| 2004 | 22,054,000 | #14 |
| 2003 | 21,119,000 | #12 |
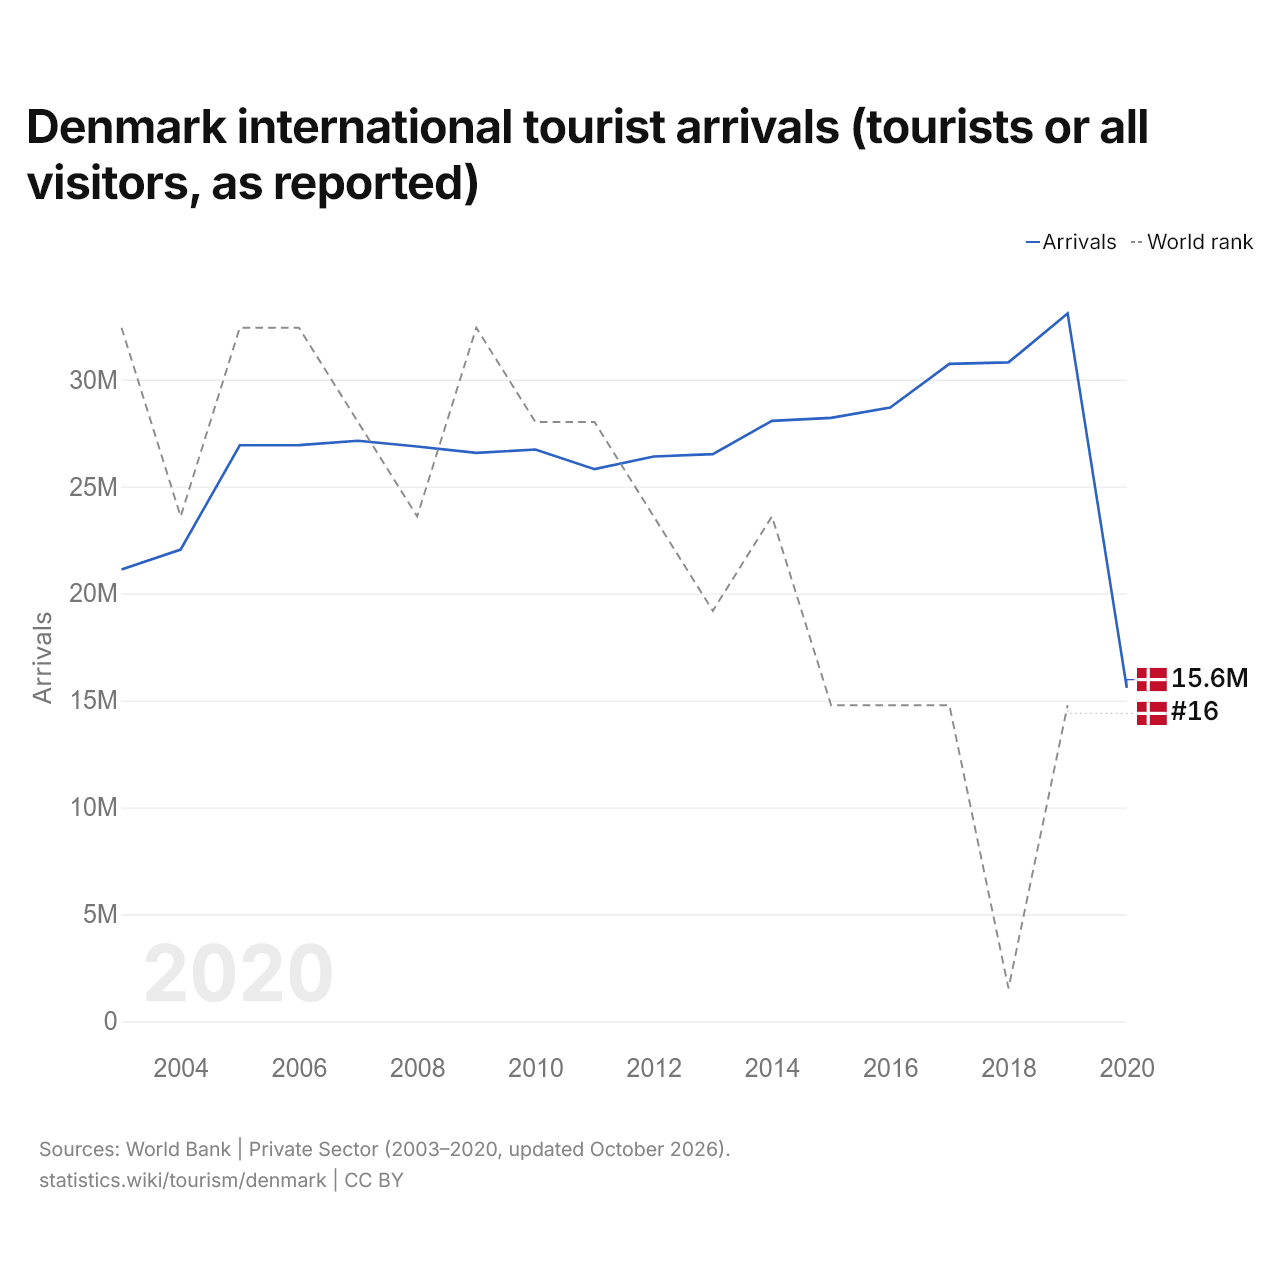
International arrivals in Denmark number 15.6 million, down from 21.1 million in 2003. Arrivals were highest in 2019, at 33.1 million. In the ranking of 2019, it was the 16th most visited country in the world, up from 19th in 2018. Its highest rank was 12th, last held in 2009.
In 2019, Denmark was the 11th most visited of 43 countries in Europe. Denmark's arrivals are 53% fewer than the year before.
Denmark international tourism receipts (US$)
| Year | US$ | Receipts, % of exports |
|---|---|---|
| Receipts | ||
| 2018 | $9,097,000,000 | 4.5% |
| 2017 | $8,508,000,000 | 4.6% |
| 2016 | $7,494,000,000 | 4.5% |
| 2015 | $6,685,000,000 | 4.0% |
| 2014 | $7,617,000,000 | 3.9% |
| 2013 | $6,490,000,000 | 3.4% |
| 2012 | $6,135,000,000 | 3.4% |
| 2011 | $6,366,000,000 | 3.4% |
| 2010 | $5,704,000,000 | 3.5% |
| 2009 | $5,617,000,000 | 3.7% |
| 2008 | $6,281,000,000 | 3.3% |
| 2007 | $5,978,000,000 | 3.6% |
| 2006 | $5,562,000,000 | 3.9% |
| 2005 | $5,293,000,000 | 4.2% |
| 2004 | $5,652,000,000 | 5.1% |
| 2003 | $5,271,000,000 | 5.5% |
| 2002 | $4,791,000,000 | 5.8% |
| 2001 | $4,003,000,000 | 5.3% |
| 2000 | $3,671,000,000 | 5.0% |
| 1999 | $3,698,000,000 | 5.3% |
| 1998 | $3,236,000,000 | 5.1% |
| 1997 | $3,156,000,000 | 5.1% |
| 1996 | $3,420,000,000 | 5.1% |
| 1995 | $3,691,000,000 | 5.6% |
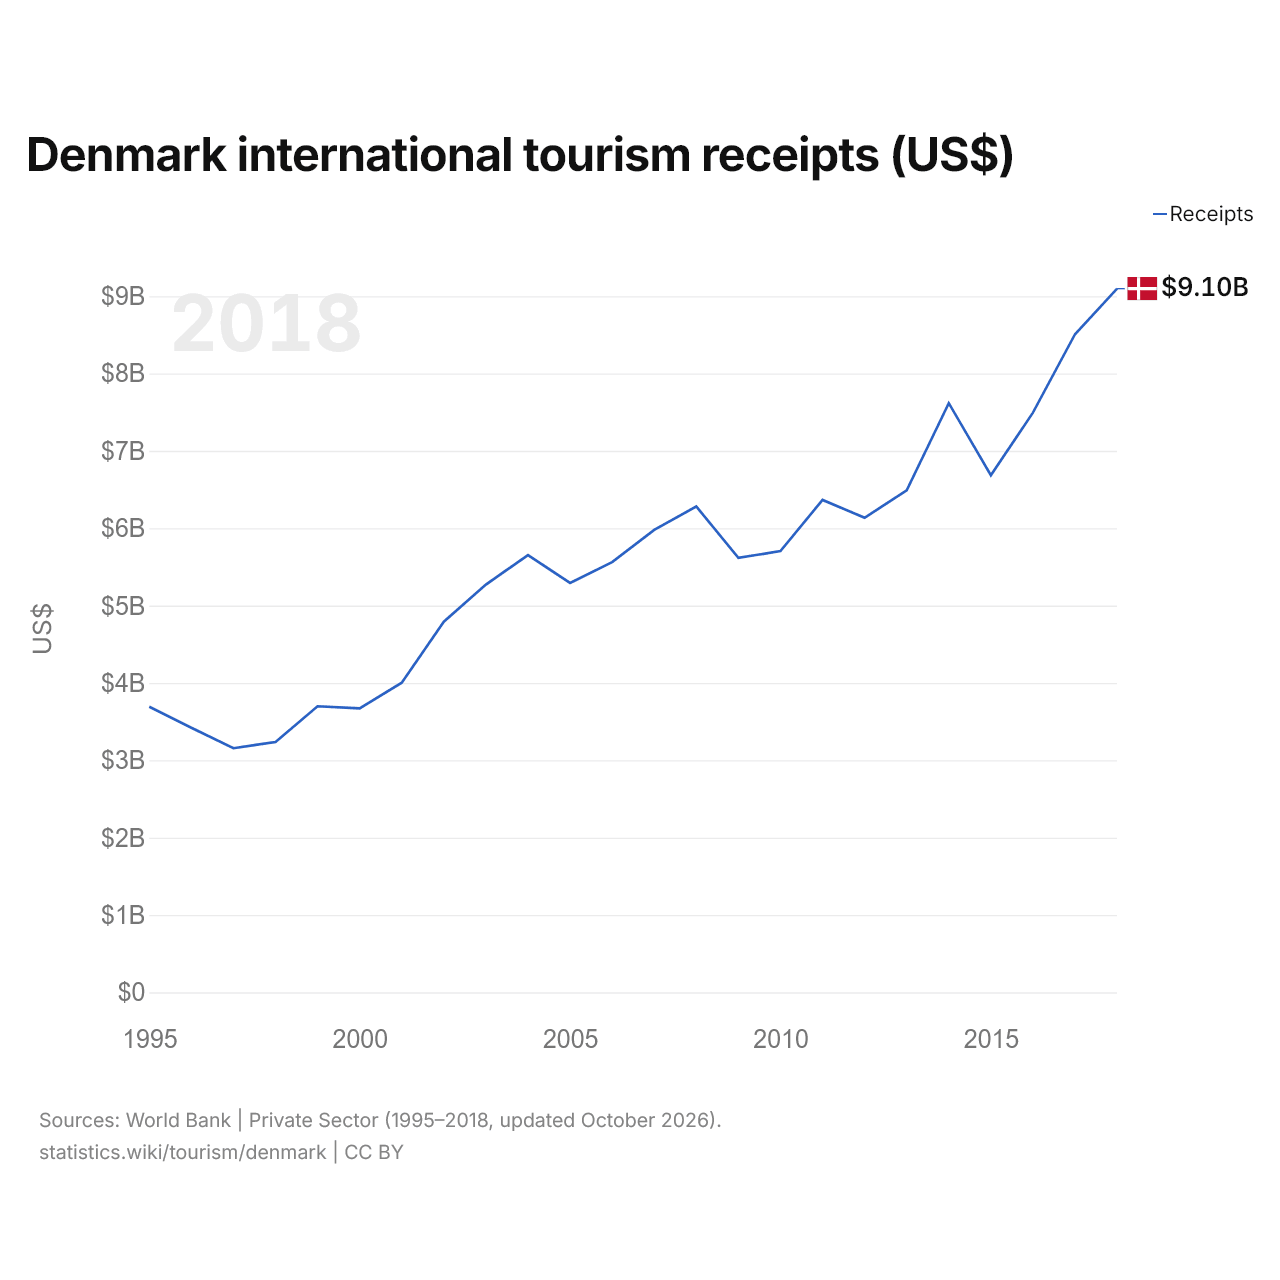
International tourism receipts of Denmark are $9.1 billion (2018), up from $3.69 billion in 1995. They were lowest in 1997, at $3.16 billion. They make up 4.5% (2018) of Denmark's exports of goods and services.
| Receipts, 2018 | $9.10B |
|---|---|
| Receipts, % of exports, 2018 | 4.5% |
Denmark in the world ranking of international tourist arrivals, 2019
| Rank | Country | Arrivals | Arrivals, 2020 | |
|---|---|---|---|---|
| 13 |
 Germany |
39.6M | 12.4M | vs Germany |
| 14 |
 Czech Republic |
37.2M | n/a | vs Czechia |
| 15 |
 Greece |
34M | 7.41M | vs Greece |
| 16 |
 Denmark |
33.1M | 15.6M | |
| 17 |
 Canada |
32.4M | n/a | vs Canada |
| 18 |
 Austria |
31.9M | 15.1M | vs Austria |
| 19 |
 Japan |
31.9M | 4.12M | vs Japan |
Compare Denmark tourism with other countries
Sources:
- World Bank | Private Sector (1995–2020, updated October 2026)
Creative Commons Attribution (CC BY): you may copy, share, adapt and reuse this content, also commercially, as long as you credit statistics.wiki and note any changes you made. The sources listed above may have their own license terms.