
Singapore vs Indonesia stock market capitalization by year (US$), 1979–2025
| Year | US$ | |
|---|---|---|
 Singapore |
 Indonesia |
|
| 2025 | $824,336,190,000 | $949,586,220,000 |
| 2024 | $637,630,270,000 | $759,829,550,000 |
| 2023 | $608,306,290,000 | $758,301,750,000 |
| 2022 | $619,361,680,000 | $610,288,390,000 |
| 2021 | $663,388,480,000 | $578,631,400,000 |
| 2020 | $652,614,660,000 | $496,086,050,000 |
| 2019 | $697,271,330,000 | $523,321,860,000 |
| 2018 | $687,257,160,000 | $486,765,920,000 |
| 2017 | $787,255,330,000 | $520,686,680,000 |
| 2016 | $640,427,546,857 | $425,767,769,936 |
| 2015 | $639,955,900,000 | $353,270,960,000 |
| 2014 | $752,831,010,000 | $422,127,050,000 |
| 2013 | $744,413,230,000 | $346,673,810,000 |
| 2012 | $765,077,960,000 | $428,222,560,000 |
| 2011 | $598,272,700,000 | $390,106,890,000 |
| 2010 | $647,226,410,000 | $360,388,100,000 |
| 2009 | $481,246,700,000 | $214,941,470,000 |
| 2008 | $264,974,400,000 | $98,760,600,000 |
| 2007 | $539,176,630,000 | $211,692,970,000 |
| 2006 | $384,286,350,000 | $138,886,360,000 |
| 2005 | $257,339,760,000 | $81,428,120,000 |
| 2004 | $217,495,360,000 | $73,250,640,000 |
| 2003 | $148,502,640,000 | $54,659,060,000 |
| 2002 | $101,485,500,000 | $30,066,960,000 |
| 2001 | $115,688,600,000 | $22,997,860,000 |
| 2000 | $152,826,410,000 | $26,812,500,000 |
| 1999 | $192,983,190,000 | $64,044,670,000 |
| 1998 | $94,986,670,000 | $22,077,860,000 |
| 1997 | $104,437,980,000 | $29,050,020,000 |
| 1996 | $150,043,560,000 | $90,997,080,000 |
| 1995 | $148,004,240,000 | $66,584,940,000 |
| 1994 | $134,088,500,000 | - |
| 1993 | $132,667,860,000 | - |
| 1992 | $48,933,600,000 | - |
| 1991 | $47,593,400,000 | - |
| 1990 | $34,268,500,000 | - |
| 1989 | $35,924,510,000 | - |
| 1988 | $24,011,770,000 | - |
| 1987 | $17,876,810,000 | - |
| 1986 | $16,620,000,000 | - |
| 1985 | $11,069,260,000 | - |
| 1984 | $12,246,510,000 | - |
| 1983 | $15,525,340,000 | - |
| 1982 | $11,732,560,000 | - |
| 1981 | $34,807,650,000 | - |
| 1980 | $24,417,910,000 | - |
| 1979 | $13,609,730,000 | - |
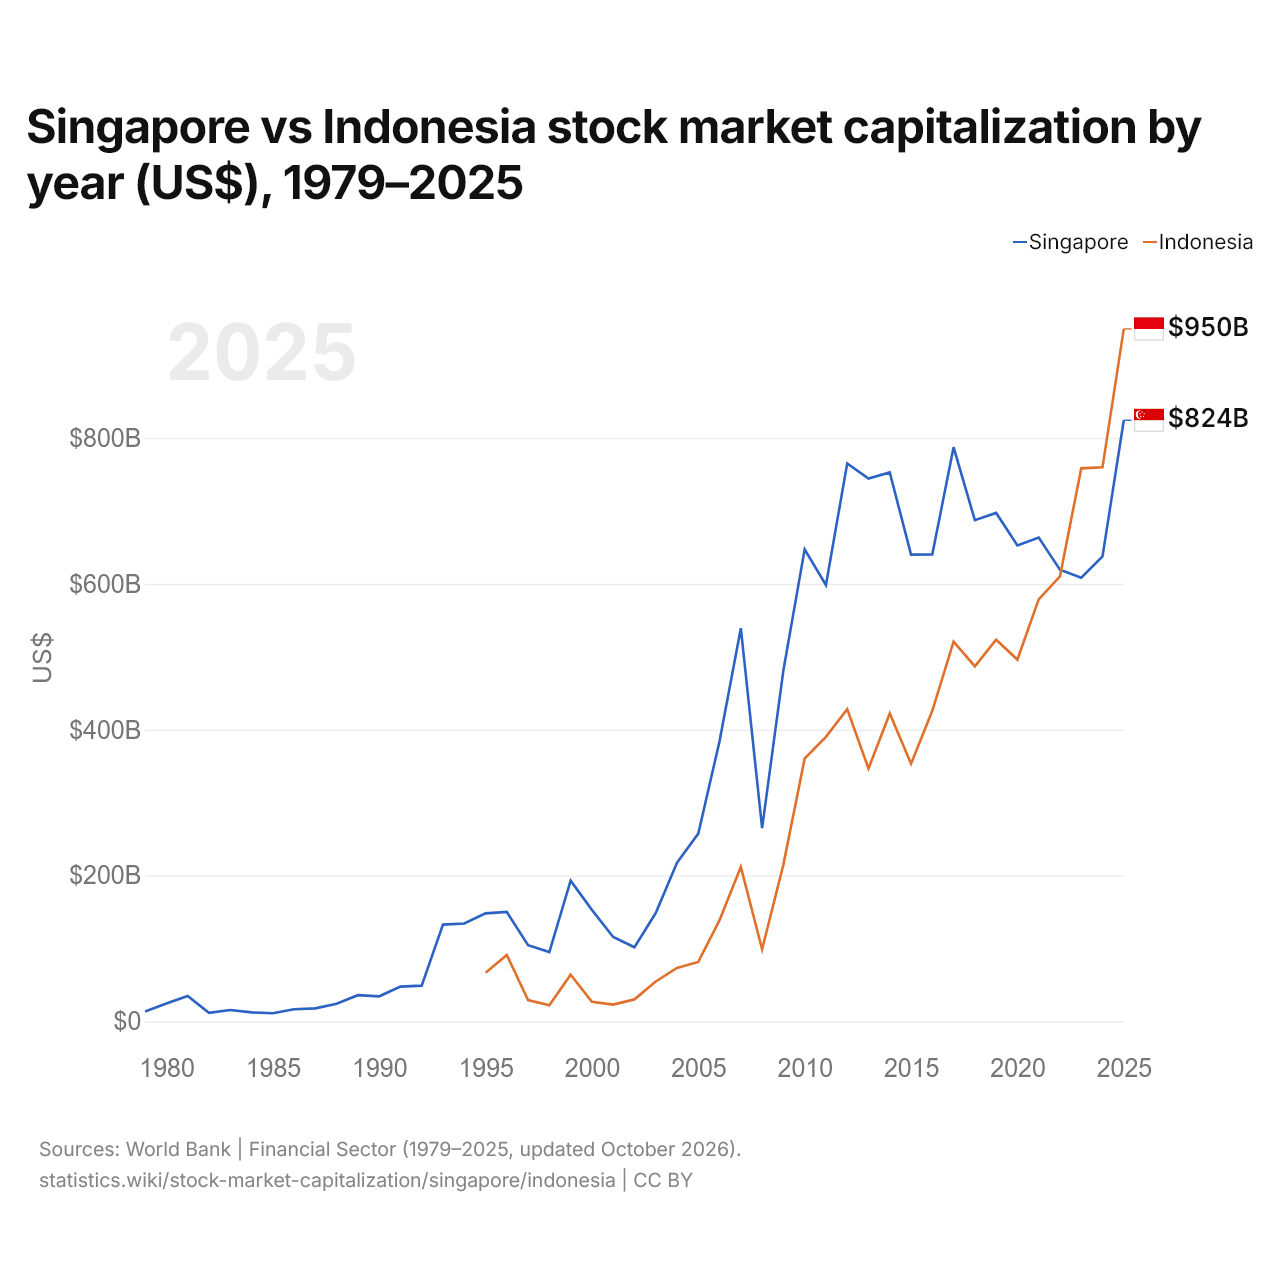
In 2025, the listed companies of Singapore were worth $824 billion and those of Indonesia $950 billion: 15% more for Indonesia. In 1995, the listed companies of Singapore were worth 2.2 times as much: $148 billion for Singapore and $66.6 billion for Indonesia.
The value of the domestic companies listed in Indonesia has been larger than in Singapore every year since 2023.
Singapore vs Indonesia market capitalization, % of GDP by year, 1979–2025
| Year | % of GDP | |
|---|---|---|
|
Singapore
|
Indonesia
|
|
| 2025 | 136.5% | 65.7% |
| 2024 | 111.3% | 54.4% |
| 2023 | 119% | 55.3% |
| 2022 | 120.4% | 46.3% |
| 2021 | 150.4% | 48.8% |
| 2020 | 185.8% | 46.8% |
| 2019 | 185% | 46.8% |
| 2018 | 181.8% | 46.7% |
| 2017 | 228.3% | 51.3% |
| 2016 | 199.7% | 45.7% |
| 2015 | 207.8% | 41% |
| 2014 | 239.1% | 47.4% |
| 2013 | 242% | 38% |
| 2012 | 259.3% | 46.7% |
| 2011 | 214.2% | 43.7% |
| 2010 | 269.9% | 47.7% |
| 2009 | 247.9% | 39.8% |
| 2008 | 136.9% | 19.4% |
| 2007 | 298% | 49% |
| 2006 | 258.6% | 38.1% |
| 2005 | 201.3% | 28.5% |
| 2004 | 189.1% | 28.5% |
| 2003 | 152.1% | 23.3% |
| 2002 | 109.7% | 15.4% |
| 2001 | 128.8% | 14.3% |
| 2000 | 159.1% | 16.2% |
| 1999 | 223.7% | 45.7% |
| 1998 | 110.8% | 23.1% |
| 1997 | 104.3% | 13.5% |
| 1996 | 155.8% | 40% |
| 1995 | 168.5% | 32.9% |
| 1994 | 182% | - |
| 1993 | 218.9% | - |
| 1992 | 93.9% | - |
| 1991 | 104.7% | - |
| 1990 | 94.8% | - |
| 1989 | 117.9% | - |
| 1988 | 94.6% | - |
| 1987 | 85.5% | - |
| 1986 | 89.4% | - |
| 1985 | 57.8% | - |
| 1984 | 62% | - |
| 1983 | 87.3% | - |
| 1982 | 72.9% | - |
| 1981 | 245.6% | - |
| 1980 | 205.3% | - |
| 1979 | 146.4% | - |
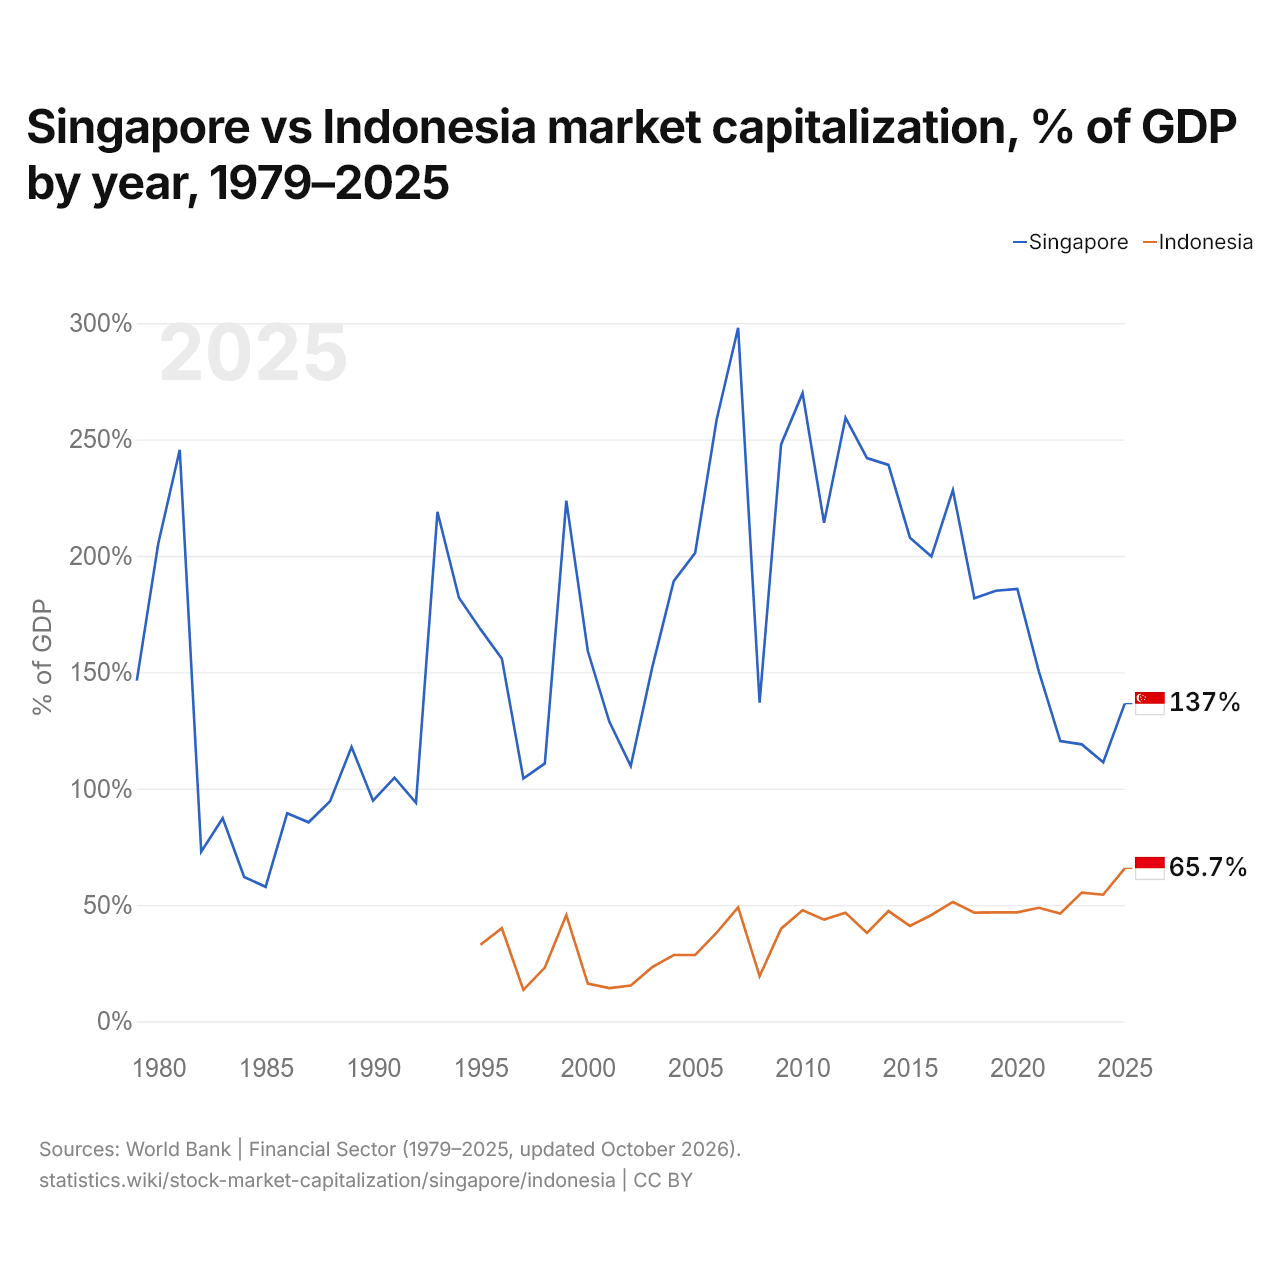
In 2025, market capitalization was equal to 136.5% of GDP in Singapore and 65.7% in Indonesia: 70.8 percentage points more in Singapore. In 2015, the shares were 207.8% in Singapore and 41.0% in Indonesia, 166.8 percentage points more in Singapore.
Singapore vs Indonesia: latest market capitalization and listed companies
Compare the stock market capitalization of any 2 countries
Sources:
- World Bank | Financial Sector (1979–2025, updated October 2026)
Creative Commons Attribution (CC BY): you may copy, share, adapt and reuse this content, also commercially, as long as you credit statistics.wiki and note any changes you made. The sources listed above may have their own license terms.