
Stock market capitalization of domestic listed companies by country, 2025
| Rank | Country | Market capitalization | % of GDP | Listed domestic companies |
|---|---|---|---|---|
| 1 |  United States |
$68.9T | 224.0% | 3,908 |
| 2 |  China |
$15.5T | 79.5% | 11,149 |
| 3 |  Japan |
$7.61T | 171.6% | 3,942 |
| 4 |  India |
$5.13T (2024) | 136.4% | 2,673 |
| 5 |  Canada |
$4.62T | 199.2% | 4,377 |
| 6 |  United Kingdom |
$3.10T (2022) | 97.3% | 1,606 |
| 7 |  Germany |
$2.90T | 57.4% | 416 |
| 8 |  South Korea |
$2.76T | 147.2% | 2,653 |
| 9 |  Switzerland |
$2.51T | 240.9% | 201 |
| 10 |  Saudi Arabia |
$2.36T | 184.7% | 391 |
| 11 |  Australia |
$2.05T | 113.9% | 1,782 |
| 12 |  South Africa |
$1.40T | 327.2% | 212 |
| 13 |  Spain |
$1.30T | 68.1% | 272 |
| 14 |  UAE |
$1.11T | n/a | 153 |
| 15 |  Indonesia |
$950B | 65.7% | 956 |
| 16 |  Brazil |
$871B | 38.2% | 357 |
| 17 |  Singapore |
$824B | 136.5% | 394 |
| 18 |  Russia |
$650B (2023) | 31.8% | 194 |
| 19 |  Mexico |
$560B | 30.6% | 129 (2024) |
| 20 |  Thailand |
$512B | 88.8% | 868 |
| 21 |  Malaysia |
$487B | 103.2% | 1,072 |
| 22 |  Chile |
$487B | 136.2% | 433 |
| 23 |  Turkey |
$404B | 25.3% | 569 |
| 24 |  Israel |
$331B (2024) | 61.0% | 511 |
| 25 |  Poland |
$316B | 30.6% | 737 |
| 26 |  Vietnam |
$316B | 61.4% | 400 |
| 27 |  Philippines |
$232B | 47.6% | 279 |
| 28 |  Austria |
$211B | 36.4% | 67 |
| 29 |  Iran |
$186B | 51.2% | 630 |
| 30 |  Qatar |
$177B | 82.1% | 54 |
| 31 |  Kuwait |
$172B | 109.5% | 135 |
| 32 |  Kazakhstan |
$158B | 51.7% | 80 |
| 33 |  Colombia |
$133B | 29.0% | 61 |
| 34 |  Greece |
$129B | 46.0% | 139 |
| 35 |  Morocco |
$114B | 62.5% | 78 |
| 36 |  Peru |
$105B | 31.4% | 176 |
| 37 |  New Zealand |
$103B | 39.1% | 106 |
| 38 |  Nigeria |
$86.9B | 29.9% | 165 |
| 39 |  Romania |
$70.9B | 16.5% | 83 |
| 40 |  Pakistan |
$70.3B | 17.3% | 535 |
| 41 |  Luxembourg |
$69.4B | 68.6% | 28 |
| 42 |  Egypt |
$62.9B | 17.2% | 244 |
| 43 |  Hungary |
$62.6B | 25.4% | 70 |
| 44 |  Czech Republic |
$55.4B | 14.2% | 26 |
| 45 |  Argentina |
$52.9B (2022) | 8.4% | 85 (2021) |
| 46 |  Oman |
$41.3B | 37.7% | 108 |
| 47 |  Croatia |
$37.9B | 36.1% | 81 |
| 48 |  Jordan |
$37.4B | 60.7% | 162 |
| 49 |  Cyprus |
$27.9B | 67.7% | 87 |
| 50 |  Panama |
$27.2B | 30.0% | 40 |
| 51 |  Bangladesh |
$26.2B | 5.7% | 360 |
| 52 |  Sri Lanka |
$26.1B | 24.0% | 288 |
| 53 |  Uzbekistan |
$23.7B | 16.1% | 85 |
| 54 |  Kenya |
$22.8B | 16.8% | 59 |
| 55 |  Bahrain |
$21.3B | 43.5% | 39 |
| 56 |  Slovenia |
$20.7B | 26.0% | 17 |
| 57 |  Ghana |
$16.4B | 14.4% | 31 |
| 58 |  Zambia |
$14.9B | 51.6% | 20 |
| 59 |  Tunisia |
$12.0B | 20.8% | 75 |
| 60 |  Jamaica |
$11.6B | 51.0% | 100 |
| 61 |  Bulgaria |
$11.2B | 8.5% | 203 |
| 62 |  Lebanon |
$10.6B (2021) | 45.7% | 10 |
| 63 |  Tanzania |
$9.78B | 10.8% | 22 |
| 64 |  Mauritius |
$8.89B | 55.0% | 92 |
| 65 |  Ivory Coast |
$7.33B (2020) | 11.6% | 46 |
| 66 |  Belarus |
$5.54B | 5.9% | 12 |
| 67 |  Malta |
$5.35B | 19.3% | 35 |
| 68 |  Palestine |
$4.94B | 28.8% | 48 |
| 69 |  Armenia |
$4.85B (2024) | 18.7% | 12 |
| 70 |  Botswana |
$4.28B | 21.5% | 23 |
| 71 |  Rwanda |
$3.20B | 19.6% | 5 |
| 72 |  Barbados |
$2.78B (2020) | 51.5% | 15 |
| 73 |  Namibia |
$2.48B (2024) | 18.2% | 12 |
| 74 |  Costa Rica |
$2.23B (2022) | 3.1% | 9 |
| 75 |  Azerbaijan |
$1.57B | 2.1% | 36 |
| 76 |  Seychelles |
$646M | 27.1% | 15 |
| 77 |  Cayman Islands |
$644M (2020) | 11.4% | 4 |
| Not ranked: latest data before 2020 | ||||
 France |
$2.37T (2018) | 85.1% | 457 | |
 Netherlands |
$1.10T (2017) | 129.7% | 102 | |
 Italy |
$587B (2014) | 27.0% | 290 | |
 Belgium |
$321B (2018) | 59.2% | 117 (2015) | |
 Norway |
$296B (2019) | 69.7% | 180 (2017) | |
 Sweden |
$290B (2003) | 86.8% | 278 (2002) | |
 Denmark |
$151B (2004) | 60.1% | 178 | |
 Ireland |
$110B (2018) | 27.8% | 43 | |
 Portugal |
$61.9B (2018) | 25.6% | 40 | |
 Finland |
$20.3B (2004) | 10.3% | 134 | |
 Slovakia |
$5.38B (2014) | 5.3% | 67 (2013) | |
 Ukraine |
$4.42B (2018) | 3.4% | 78 | |
 Serbia |
$4.06B (2011) | 7.9% | n/a | |
 Venezuela |
$3.98B (2002) | 4.3% | 57 | |
 Trinidad |
$3.89B (2001) | 44.1% | n/a | |
 Montenegro |
$3.79B (2012) | 93.0% | 112 | |
 Zimbabwe |
$2.46B (1999) | 35.9% | 69 | |
 Papua New Guinea |
$1.68B (2017) | 7.4% | 6 (2016) | |
 Ecuador |
$747M (2000) | 4.3% | 26 | |
 Algeria |
$371M (2018) | 0.2% | n/a | |
 Paraguay |
$313M (1999) | 3.5% | 55 | |
 Uruguay |
$284M (1996) | 1.4% | 18 | |
 Eswatini |
$234M (2007) | 6.9% | 6 | |
The list ranks 77 countries by their latest stock market capitalization, from the United States ($68.9 trillion) to the Cayman Islands ($644 million, 2020). In half of the countries, the listed companies were worth less than $70.9 billion.
Market capitalization is the value of the shares of a country's domestic companies listed on its stock exchanges: each company's share price times its number of shares, at the end of the year. Investment funds and foreign companies listed there are not included. The figures are in current US dollars, so they move with share prices and exchange rates; the share of GDP compares them with the size of the country's economy. Countries whose latest figure is more than five years older than the newest are listed below the table without a rank.
Map of stock market capitalization by country, 1997–2025
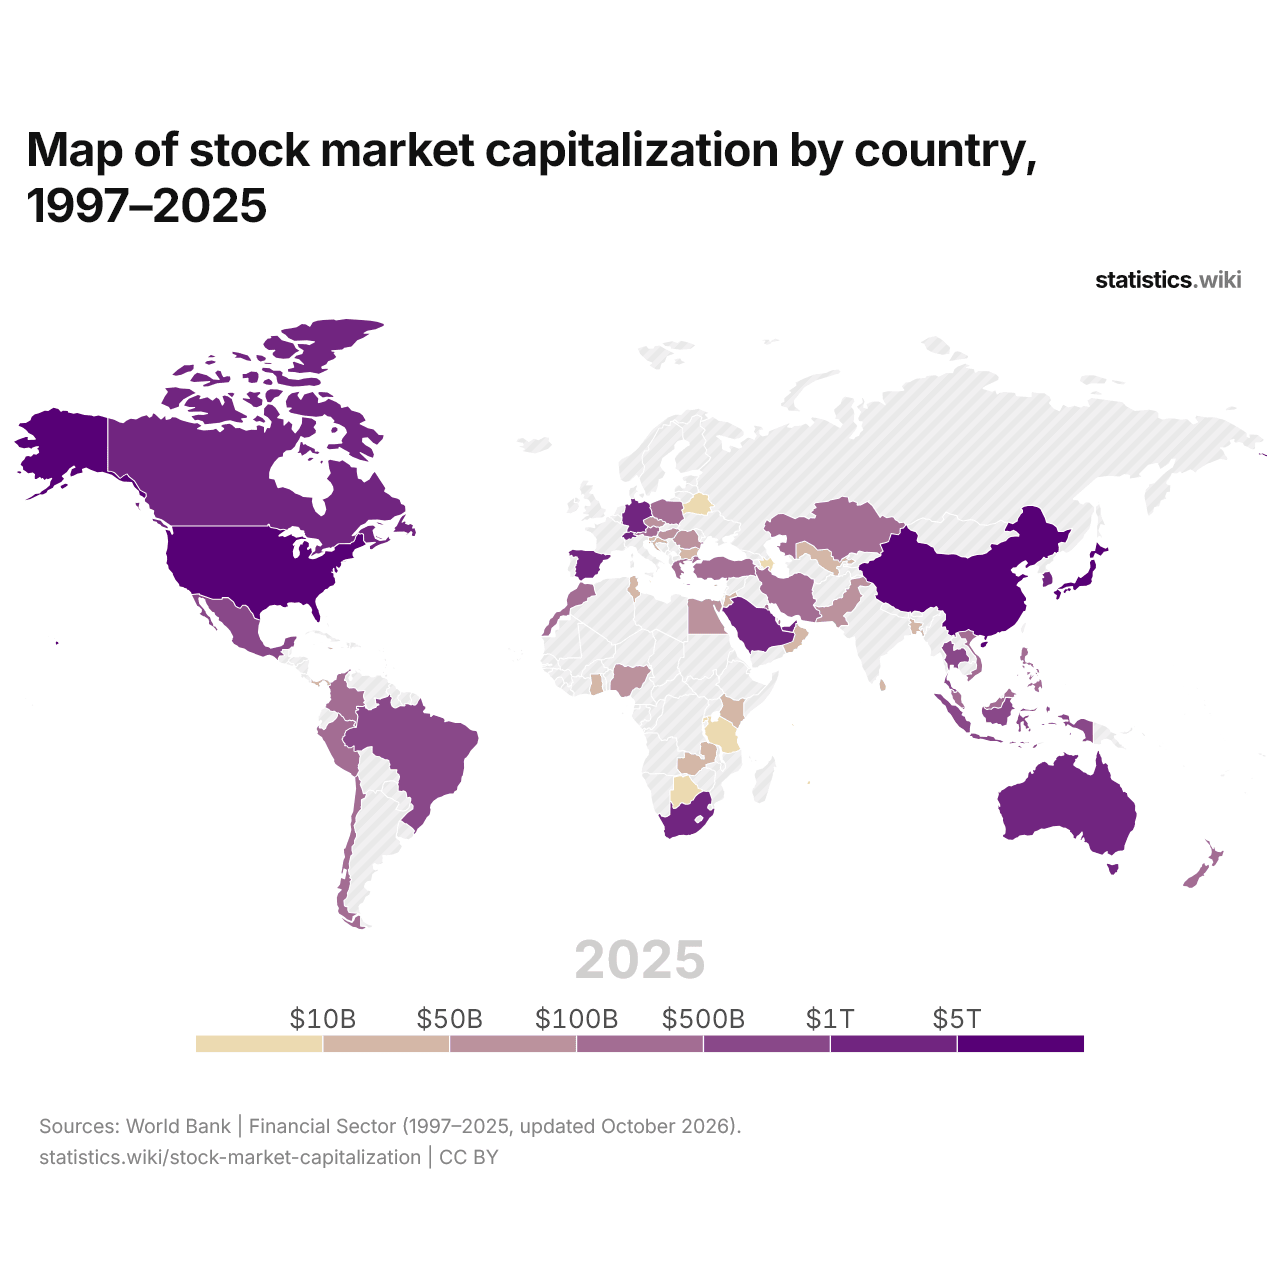
In 2025, the listed companies of 12 countries were worth more than $1 trillion and those of 9 less than $10 billion; in 1997, the numbers were 4 and 23.
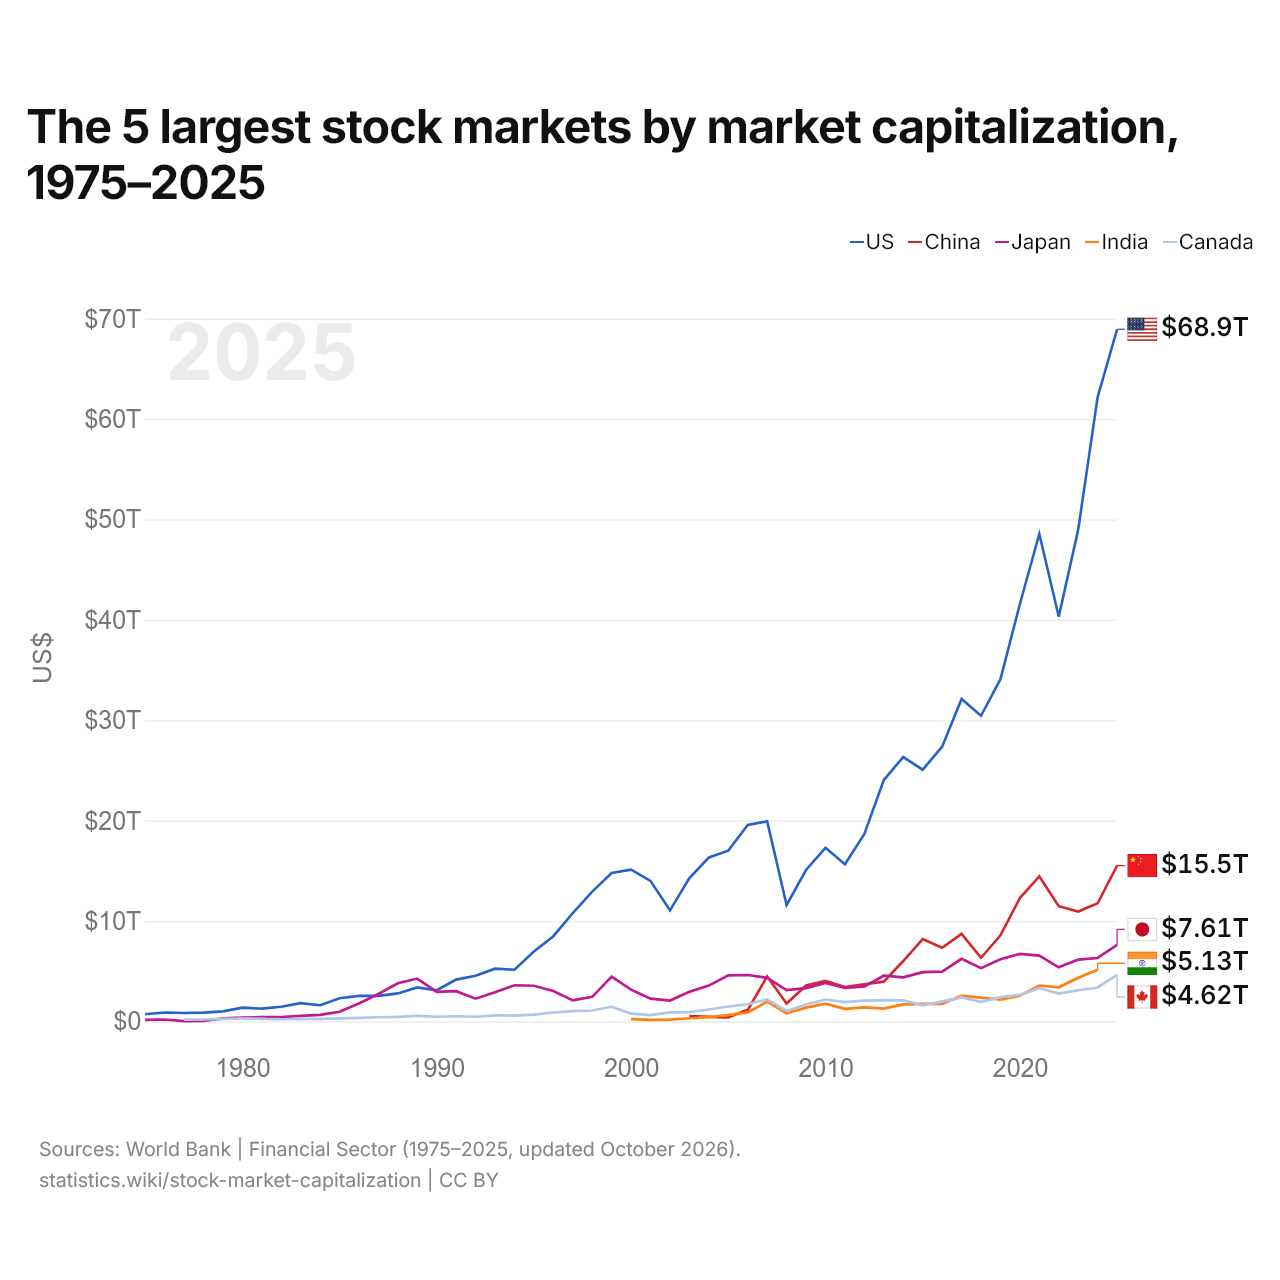
The 5 largest stock markets by market capitalization, 1975–2025
| Year | US$ | ||||
|---|---|---|---|---|---|
| United States | China | Japan | India | Canada | |
| 2025 | $68,937,866,210,000 | $15,508,858,500,000 | $7,610,543,670,000 | - | $4,621,231,170,000 |
| 2024 | $62,185,685,320,000 | $11,755,757,950,000 | $6,310,681,430,000 | $5,131,397,430,000 | $3,374,477,170,000 |
| 2023 | $48,979,397,700,000 | $10,935,845,590,000 | $6,149,200,180,000 | $4,340,130,780,000 | $3,099,135,030,000 |
| 2022 | $40,297,980,320,000 | $11,469,346,090,000 | $5,380,475,460,000 | $3,387,366,670,000 | $2,760,871,360,000 |
| 2021 | $48,548,538,120,000 | $14,437,446,150,000 | $6,544,303,490,000 | $3,548,018,470,000 | $3,302,816,830,000 |
| 2020 | $41,569,861,770,000 | $12,276,766,270,000 | $6,718,219,550,000 | $2,552,463,790,000 | $2,641,455,040,000 |
| 2019 | $34,085,727,370,000 | $8,569,512,150,000 | $6,191,073,290,000 | $2,162,702,910,000 | $2,409,098,540,000 |
| 2018 | $30,436,313,050,000 | $6,324,879,760,000 | $5,296,811,100,000 | - | $1,937,902,710,000 |
| 2017 | $32,120,702,650,000 | $8,711,267,220,000 | $6,222,825,210,000 | $2,555,988,798,538 | $2,367,059,920,000 |
| 2016 | $27,352,200,720,000 | $7,320,738,379,789 | $4,955,299,652,289 | $1,746,297,399,290 | $1,993,522,735,730 |
| 2015 | $25,067,539,600,000 | $8,188,019,320,000 | $4,894,919,120,000 | $1,745,169,237,451 | $1,593,399,300,000 |
| 2014 | $26,330,589,190,000 | $6,004,947,670,000 | $4,377,994,370,000 | $1,686,708,487,025 | $2,095,420,680,000 |
| 2013 | $24,034,853,520,000 | $3,949,143,490,000 | $4,543,169,140,000 | $1,265,063,578,241 | $2,113,821,770,000 |
| 2012 | $18,668,333,210,000 | $3,697,376,040,000 | $3,478,831,520,000 | $1,390,416,295,255 | $2,059,973,580,000 |
| 2011 | $15,640,707,040,000 | $3,412,108,290,000 | $3,325,387,760,000 | $1,244,598,654,110 | $1,912,871,970,000 |
| 2010 | $17,283,451,680,000 | $4,027,840,300,000 | $3,827,774,200,000 | $1,762,461,862,599 | $2,171,194,840,000 |
| 2009 | $15,077,285,740,000 | $3,573,152,460,000 | $3,306,082,050,000 | $1,367,309,893,276 | $1,677,431,720,000 |
| 2008 | $11,590,277,780,000 | $1,778,784,040,000 | $3,115,803,730,000 | $791,308,008,892 | $1,033,651,810,000 |
| 2007 | $19,922,279,820,000 | $4,478,866,530,000 | $4,330,921,860,000 | $1,961,859,187,267 | $2,186,550,150,000 |
| 2006 | $19,568,972,500,000 | $1,145,454,870,000 | $4,614,068,830,000 | $895,269,881,904 | $1,700,708,090,000 |
| 2005 | $17,000,864,470,000 | $401,852,250,000 | $4,572,901,030,000 | $624,739,583,186 | $1,482,184,560,000 |
| 2004 | $16,323,726,330,000 | $447,720,260,000 | $3,557,674,430,000 | $415,544,312,811 | $1,177,517,940,000 |
| 2003 | $14,266,265,650,000 | $512,978,770,000 | $2,953,098,300,000 | $308,994,959,404 | $910,230,610,000 |
| 2002 | $11,054,430,000,000 | - | $2,069,299,120,000 | $172,185,662,293 | $888,677,700,000 |
| 2001 | $13,983,666,000,000 | - | $2,264,527,900,000 | $148,771,635,310 | $615,265,930,000 |
| 2000 | $15,107,751,000,000 | - | $3,157,221,780,000 | $225,648,371,926 | $770,841,540,000 |
| 1999 | $14,777,387,400,000 | - | $4,455,348,090,000 | - | $1,448,278,090,000 |
| 1998 | $12,922,580,000,000 | - | $2,439,548,790,000 | - | $1,081,927,730,000 |
| 1997 | $10,770,143,000,000 | - | $2,085,370,340,000 | - | $1,010,507,310,000 |
| 1996 | $8,480,497,000,000 | - | $3,019,733,730,000 | - | $879,797,610,000 |
| 1995 | $6,952,026,000,000 | - | $3,545,306,510,000 | - | $671,742,800,000 |
| 1994 | $5,137,739,860,000 | - | $3,592,193,910,000 | - | $575,716,370,000 |
| 1993 | $5,251,079,630,000 | - | $2,906,298,700,000 | - | $595,516,360,000 |
| 1992 | $4,545,844,000,000 | - | $2,254,844,100,000 | - | $457,949,900,000 |
| 1991 | $4,159,595,200,000 | - | $3,005,697,400,000 | - | $508,633,200,000 |
| 1990 | $3,093,448,500,000 | - | $2,928,533,730,000 | - | $458,678,620,000 |
| 1989 | $3,382,233,600,000 | - | $4,260,382,520,000 | - | $543,396,610,000 |
| 1988 | $2,779,940,700,000 | - | $3,789,032,960,000 | - | $446,806,410,000 |
| 1987 | $2,531,767,700,000 | - | $2,726,369,260,000 | - | $405,600,860,000 |
| 1986 | $2,537,942,200,000 | - | $1,783,639,430,000 | - | $336,895,680,000 |
| 1985 | $2,300,857,900,000 | - | $948,262,520,000 | - | $292,880,140,000 |
| 1984 | $1,602,159,700,000 | - | $644,412,020,000 | - | $246,632,360,000 |
| 1983 | $1,809,034,400,000 | - | $545,848,260,000 | - | $257,634,200,000 |
| 1982 | $1,456,865,200,000 | - | $417,405,180,000 | - | $207,092,900,000 |
| 1981 | $1,263,560,700,000 | - | $417,943,120,000 | - | - |
| 1980 | $1,359,797,800,000 | - | $379,212,790,000 | - | $285,706,860,000 |
| 1979 | $993,590,900,000 | - | $289,123,900,000 | - | $238,944,270,000 |
| 1978 | $861,961,000,000 | - | $34,198,150,000 | - | $179,690,430,000 |
| 1977 | $834,238,000,000 | - | $21,530,430,000 | - | $173,941,850,000 |
| 1976 | $883,100,000,000 | - | $180,900,950,000 | - | - |
| 1975 | $703,800,000,000 | - | $141,799,090,000 | - | - |
In 2025, the listed companies of the United States were worth $68.9 trillion, those of China $15.5 trillion, Japan $7.61 trillion, India $5.13 trillion (2024) and Canada $4.62 trillion. The United States' stock market has been the largest of the five since 1990. The most recent change in their order came in 2021, when India passed Canada.
The 10 countries with the highest market capitalization, % of GDP, 2025
The 10 countries with the lowest market capitalization, % of GDP, 2025
-
Azerbaijan
-
Costa Rica
-
Bangladesh
-
Belarus
-
Argentina
-
Bulgaria
-
Tanzania
-
Cayman Islands
-
Ivory Coast
-
Czech Republic
In 2025, the listed companies were worth the most compared with GDP in South Africa, 327.2% of GDP, and the least in Azerbaijan, 2.1%.
The 10 largest stock markets each year, 1997–2025
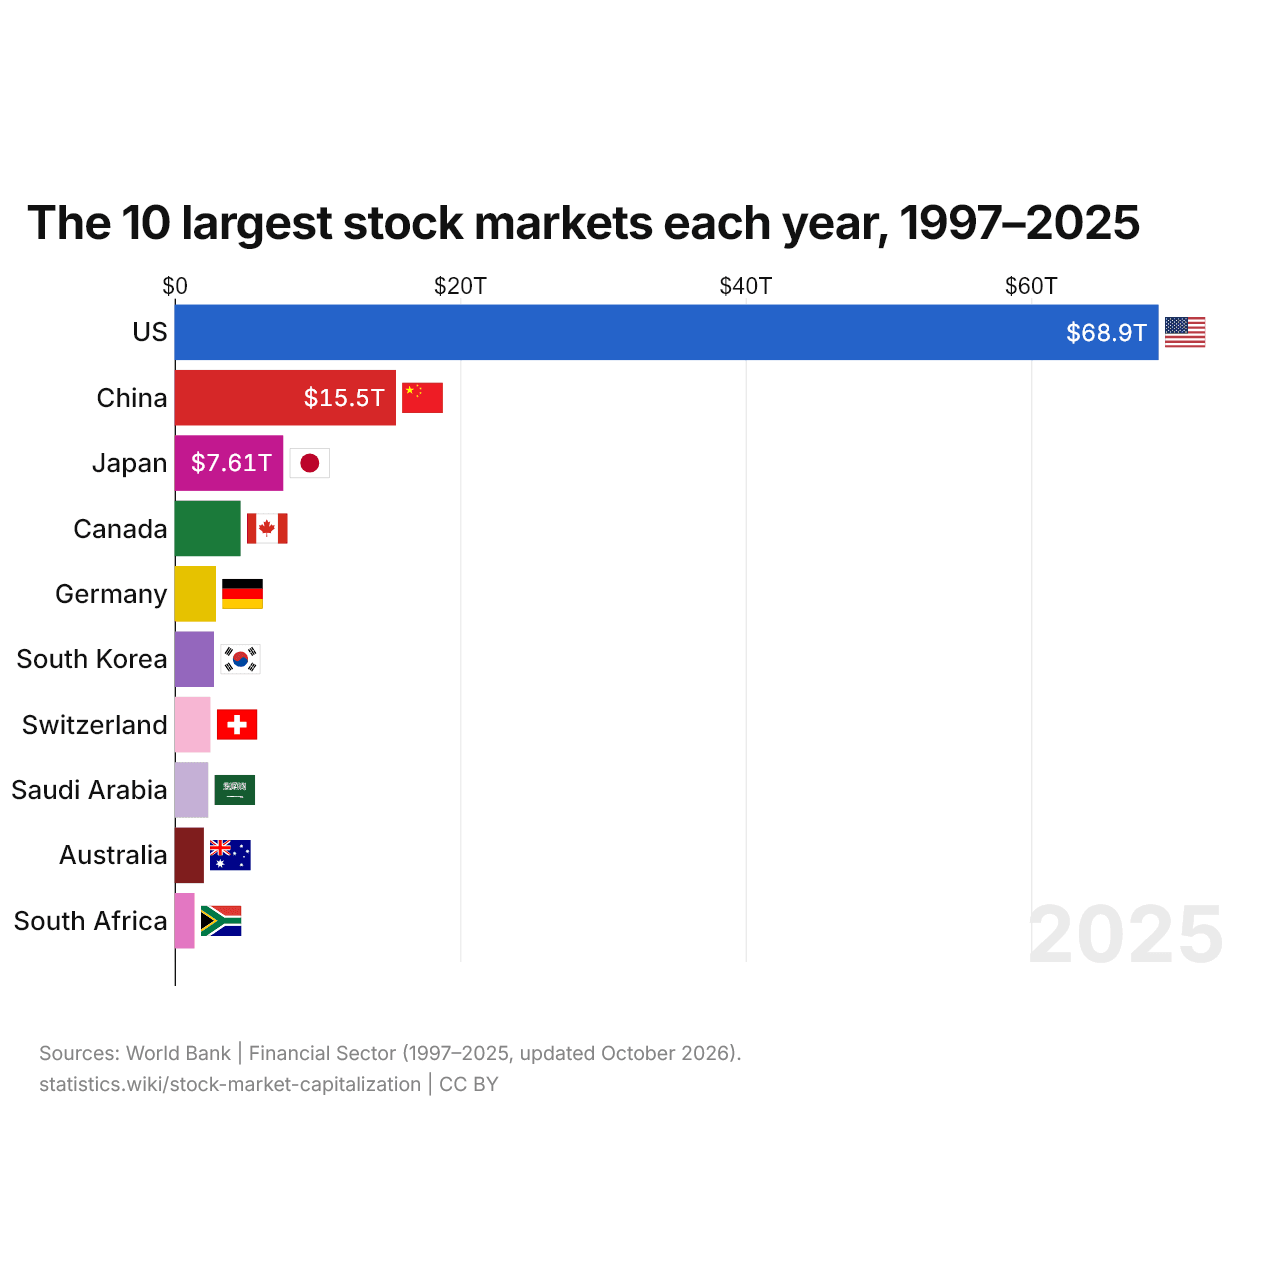
The United States had the largest stock market both in 1997 ($10.8 trillion) and in 2025 ($68.9 trillion). South Korea moved up the most among them, from 26th in 1997 to 6th in 2025.
Compare the stock market capitalization of any 2 countries
Sources:
- World Bank | Financial Sector (1975–2025, updated October 2026)
Creative Commons Attribution (CC BY): you may copy, share, adapt and reuse this content, also commercially, as long as you credit statistics.wiki and note any changes you made. The sources listed above may have their own license terms.