
Foreign direct investment (FDI) by country: net inflows, 2025
| Rank | Country | Net inflows | % of GDP | Net outflows |
|---|---|---|---|---|
 World |
+$1.53T | +1.3% | ||
| 1 |  United States |
+$307B | +1.0% | +$390B |
| 2 |  Singapore |
+$159B | +26.3% | +$94.2B |
| 3 |  Germany |
+$95.2B | +1.9% | +$108B |
| 4 |  China |
+$80.0B | +0.4% | +$157B |
| 5 |  Brazil |
+$77.7B | +3.4% | +$30.2B |
| 6 |  Ireland |
+$75.0B | +10.4% | +$86.4B |
| 7 |  Canada |
+$70.1B | +3.0% | +$56.9B |
| 8 |  France |
+$61.1B | +1.8% | +$96.7B |
| 9 |  UAE |
+$48.2B | n/a | +$63.4B |
| 10 |  Japan |
+$45.8B | +1.0% | +$218B |
| 11 |  Mexico |
+$44.6B | +2.4% | +$13.0B |
| 12 |  India |
+$40.8B | +1.0% | +$38.2B |
| 13 |  United Kingdom |
+$37.6B | +0.9% | +$9.43B |
| 14 |  Australia |
+$37.4B | +2.1% | −$6.75B |
| 15 |  Cayman Islands |
+$35.8B | n/a | +$25.3B |
| 16 |  Saudi Arabia |
+$32.6B | +2.6% | +$27.0B |
| 17 |  Spain |
+$28.6B | +1.5% | +$47.2B |
| 18 |  Israel |
+$26.2B | +4.3% | +$14.7B |
| 19 |  Indonesia |
+$22.7B | +1.6% | +$8.15B |
| 20 |  Vietnam |
+$22.0B | +4.3% | +$700M |
| 21 |  Malaysia |
+$21.6B | +4.6% | +$9.09B |
| 22 |  Poland |
+$20.9B | +2.0% | +$8.24B |
| 23 |  Thailand |
+$18.5B | +3.2% | +$9.58B |
| 24 |  Sweden |
+$17.3B | +2.6% | +$7.36B |
| 25 |  Denmark |
+$16.9B | +3.7% | +$52.8B |
| 26 |  South Korea |
+$15.8B | +0.8% | +$41.2B |
| 27 |  Egypt |
+$15.5B | +4.2% | +$696M |
| 28 |  Chile |
+$14.5B | +4.1% | +$8.68B |
| 29 |  Malta |
+$14.4B | +51.7% | +$11.4B |
| 30 |  Greece |
+$13.6B | +4.8% | +$5.96B |
| 31 |  Turkey |
+$13.0B | +0.8% | +$9.83B |
| 32 |  Portugal |
+$12.0B | +3.5% | +$8.91B |
| 33 |  Colombia |
+$11.6B | +2.5% | +$4.82B |
| 34 |  Cyprus |
+$11.2B | +27.1% | +$1.57B |
| 35 |  Russia |
+$11.1B | +0.4% | −$5.46B |
| 36 |  Czech Republic |
+$10.5B | +2.7% | +$8.62B |
| 37 |  Peru |
+$10.4B | +3.1% | +$1.42B |
| 38 |  Romania |
+$9.37B | +2.2% | +$803M |
| 39 |  Guyana |
+$8.97B | +33.1% | +$18.0M |
| 40 |  Philippines |
+$8.12B | +1.7% | +$1.60B |
| 41 |  Guinea |
+$7.76B | +27.4% | +$1.41M |
| 42 |  Oman |
+$6.75B | +6.2% | −$148M |
| 43 |  Mozambique |
+$5.76B | +25.8% | +$66.7M |
| 44 |  Costa Rica |
+$5.60B | +5.4% | +$384M |
| 45 |  Cambodia |
+$5.10B | +9.9% | +$139M |
| 46 |  Dominican Republic |
+$4.92B | +3.9% | −$114M |
| 47 |  Bulgaria |
+$4.88B | +3.7% | +$1.51B |
| 48 |  Uzbekistan |
+$4.47B | +3.0% | +$158M |
| 49 |  Argentina |
+$4.36B | +0.6% | +$2.74B |
| 50 |  Netherlands |
+$4.02B | +0.3% | +$121B |
| 51 |  Nigeria |
+$4.01B | +1.4% | +$1.19B |
| 52 |  Serbia |
+$3.94B | +3.9% | +$1.33B |
| 53 |  Ethiopia |
+$3.80B | +3.0% | n/a |
| 54 |  New Zealand |
+$3.39B | +1.3% | +$43.9M |
| 55 |  Uganda |
+$3.36B | +5.4% | +$417K |
| 56 |  Morocco |
+$3.32B | +1.8% | +$812M |
| 57 |  Lithuania |
+$3.09B | +3.2% | +$128M |
| 58 |  Qatar |
+$3.03B | +1.4% | +$3.34B |
| 59 |  Croatia |
+$2.99B | +2.8% | −$416M |
| 60 |  Mongolia |
+$2.75B | +10.8% | +$5.53M |
| 61 |  Angola |
+$2.22B | +1.8% | +$125M |
| 62 |  Slovakia |
+$2.05B | +1.3% | +$1.86B |
| 63 |  Suriname |
+$2.05B | +45.4% | −$919K |
| 64 |  Lebanon |
+$2.04B | n/a | +$265M |
| 65 |  Ivory Coast |
+$2.03B | +2.0% | +$362M |
| 66 |  Jordan |
+$2.02B | +3.3% | +$97.9M |
| 67 |  Uruguay |
+$1.94B | +2.3% | +$1.41B |
| 68 |  Ghana |
+$1.91B | +1.7% | +$38.8M |
| 69 |  DR Congo |
+$1.87B | +2.1% | +$365M |
| 70 |  Pakistan |
+$1.85B | +0.5% | +$267M |
| 71 |  Albania |
+$1.85B | +6.1% | +$342M |
| 72 |  Slovenia |
+$1.80B | +2.3% | +$1.06B |
| 73 |  Bangladesh |
+$1.78B | +0.4% | +$34.4M |
| 74 |  Tanzania |
+$1.72B | +1.9% | n/a |
| 75 |  Guatemala |
+$1.71B | +1.4% | +$2.34B |
| 76 |  Georgia |
+$1.66B | +4.3% | +$266M |
| 77 |  Belarus |
+$1.65B | +1.8% | +$371M |
| 78 |  Iran |
+$1.65B | +0.5% | +$104M |
| 79 |  Ukraine |
+$1.62B | +0.8% | −$109M |
| 80 |  Algeria |
+$1.54B | +0.5% | +$47.6M |
| 81 |  Bahamas |
+$1.54B | n/a | +$373M |
| 82 |  Nicaragua |
+$1.50B | +6.8% | +$50.9M |
| 83 |  Namibia |
+$1.45B | +9.6% | +$42.8M |
| 84 |  Laos |
+$1.40B | +7.7% | +$38.3M |
| 85 |  Ecuador |
+$1.35B | +1.0% | n/a |
| 86 |  Zambia |
+$1.29B | +4.5% | −$256M |
| 87 |  Paraguay |
+$1.18B | +2.4% | +$236M |
| 88 |  Tunisia |
+$1.14B | +2.0% | +$23.7M |
| 89 |  Kenya |
+$1.11B | +0.8% | +$430M |
| 90 |  Honduras |
+$1.07B | +2.7% | +$284M |
| 91 |  Myanmar |
+$1.07B | +1.3% | n/a |
| 92 |  Sri Lanka |
+$1.04B | +1.0% | +$98.2M |
| 93 |  Rwanda |
+$967M | +5.9% | +$13.7M |
| 94 |  Zimbabwe |
+$965M | +1.9% | +$4.70M |
| 95 |  Panama |
+$938M | +1.0% | −$871M |
| 96 |  Madagascar |
+$889M | +4.5% | +$138M |
| 97 |  Italy |
+$883M | +0.0% | +$22.9B |
| 98 |  Maldives |
+$857M | +11.1% | n/a |
| 99 |  Bosnia |
+$851M | +2.6% | +$134M |
| 100 |  Mali |
+$844M | +2.8% | +$58.4M |
| 101 |  Somalia |
+$834M | +6.4% | n/a |
| 102 |  Libya |
+$828M | +1.7% | +$80.8M |
| 103 |  Bahrain |
+$821M | +1.7% | +$550M |
| 104 |  Mauritius |
+$804M | +5.0% | +$22.4M |
| 105 |  El Salvador |
+$764M | +2.1% | +$318M |
| 106 |  Armenia |
+$708M | +2.4% | +$74.0M |
| 107 |  Turkmenistan |
+$701M | +1.4% | n/a |
| 108 |  Montenegro |
+$676M | +7.3% | +$75.1M |
| 109 |  North Macedonia |
+$676M | +3.5% | +$400M |
| 110 |  Kyrgyzstan |
+$642M | +2.8% | +$33.0M |
| 111 |  Mauritania |
+$634M | +5.4% | +$58.9K |
| 112 |  Cameroon |
+$599M | +1.0% | +$6.89M |
| 113 |  Congo |
+$596M | +3.7% | +$93.3M |
| 114 |  Malawi |
+$530M | +3.6% | +$44.6M |
| 115 |  Bolivia |
+$527M | +0.8% | +$191M |
| 116 |  Liberia |
+$500M | +9.5% | +$86.0M |
| 117 |  Benin |
+$482M | +2.0% | +$53.2M |
| 118 |  Moldova |
+$460M | +2.3% | +$99.6M |
| 119 |  Kuwait |
+$413M | +0.3% | +$2.99B |
| 120 |  Latvia |
+$403M | +0.8% | +$344M |
| 121 |  Gabon |
+$379M | +1.8% | +$55.8M |
| 122 |  Azerbaijan |
+$374M | +0.5% | +$910M |
| 123 |  Finland |
+$361M | +0.1% | +$5.26B |
| 124 |  Palestine |
+$330M | +1.9% | +$14.7M |
| 125 |  Burkina Faso |
+$312M | +1.1% | +$30.4M |
| 126 |  Equatorial Guinea |
+$294M | +2.3% | +$22.2M |
| 127 |  Jamaica |
+$283M | +1.2% | −$1.18M |
| 128 |  Antigua |
+$282M | +12.1% | −$9.34M |
| 129 |  Gambia |
+$274M | +10.6% | −$871K |
| 130 |  Barbados |
+$273M | +3.4% | +$16.7M |
| 131 |  Andorra |
+$270M | +6.0% | +$108M |
| 132 |  Fiji |
+$263M | +4.2% | +$43.1M |
| 133 |  Niger |
+$257M | +1.2% | +$6.51M |
| 134 |  East Timor |
+$253M | +13.3% | n/a |
| 135 |  Seychelles |
+$239M | +10.0% | −$47.3M |
| 136 |  Togo |
+$221M | +1.9% | +$189M |
| 137 |  Saint Lucia |
+$194M | +7.3% | +$18.7M |
| 138 |  Curacao |
+$183M | n/a | +$45.2M |
| 139 |  Sierra Leone |
+$177M | +2.4% | n/a |
| 140 |  Grenada |
+$171M | +12.0% | −$3.62M |
| 141 |  Cape Verde |
+$154M | +5.0% | +$25.7M |
| 142 |  Djibouti |
+$149M | +3.2% | n/a |
| 143 |  Saint Vincent |
+$111M | +8.9% | −$2.08M |
| 144 |  Sao Tome |
+$103M | +10.5% | +$1.12M |
| 145 |  Tajikistan |
+$85.9M | +0.5% | +$94.0M |
| 146 |  Eritrea |
+$82.4M | n/a | n/a |
| 147 |  Cuba |
+$79.5M | n/a | n/a |
| 148 |  South Sudan |
+$73.0M | n/a | n/a |
| 149 |  Solomon Islands |
+$67.3M | +3.8% | +$15.1M |
| 150 |  Brunei |
+$61.8M | +0.4% | −$95.4M |
| 151 |  Palau |
+$57.1M | +16.6% | n/a |
| 152 |  Eswatini |
+$53.1M | +1.0% | −$5.55M |
| 153 |  Dominica |
+$49.5M | +6.8% | n/a |
| 154 |  CAR |
+$43.8M | +1.4% | +$2.22M |
| 155 |  Nepal |
+$43.5M | +0.1% | +$17.3K |
| 156 |  San Marino |
+$39.9M (2024) | n/a | +$44.8M |
| 157 |  Senegal |
+$36.6M | +0.1% | +$638K |
| 158 |  Burundi |
+$35.1M | +1.0% | +$3.90M |
| 159 |  Guinea-Bissau |
+$33.6M | +1.3% | +$662K |
| 160 |  Lesotho |
+$33.5M | +1.3% | n/a |
| 161 |  Vanuatu |
+$32.9M | +2.4% | +$2.75M |
| 162 |  Saint Kitts |
+$28.4M | +2.4% | +$9.89M |
| 163 |  Afghanistan |
+$20.6M (2021) | +0.1% | +$30.8M |
| 164 |  Tonga |
+$17.9M | +2.6% | +$1.62M |
| 165 |  Switzerland |
+$15.9M | +0.0% | +$32.3B |
| 166 |  Haiti |
+$12.2M | +0.0% | n/a |
| 167 |  North Korea |
+$9.21M | n/a | +$1.90M |
| 168 |  Comoros |
+$9.20M | +0.5% | n/a |
| 169 |  Bhutan |
+$8.52M | +0.2% | n/a |
| 170 |  Chad |
+$4.30M | +0.0% | −$217M |
| 171 |  Kiribati |
+$4.16M | +1.2% | +$16.1K |
| 172 |  Marshall Islands |
+$3.21M | +1.0% | n/a |
| 173 |  Samoa |
+$2.22M | +0.2% | +$395K |
| 174 |  Belize |
+$240K | +0.0% | +$1.40M |
| 175 |  Tuvalu |
+$235K | +0.4% | n/a |
| 176 |  Sudan |
+$1.90K | +0.0% | n/a |
| 177 |  Nauru |
−$18.9K | +0.0% | +$4.20M |
| 178 |  Yemen |
−$5.00M | n/a | n/a |
| 179 |  Venezuela |
−$522M | −0.5% | +$277M |
| 180 |  Botswana |
−$649M | −3.3% | +$124M |
| 181 |  Trinidad |
−$794M | −3.1% | −$390M |
| 182 |  Iceland |
−$835M | −2.2% | −$659M |
| 183 |  Kazakhstan |
−$916M | −0.3% | +$469M |
| 184 |  Estonia |
−$1.03B | −2.2% | +$107M |
| 185 |  Papua New Guinea |
−$1.18B | −3.6% | +$539M |
| 186 |  South Africa |
−$2.16B | −0.5% | −$4.01B |
| 187 |  Norway |
−$7.08B | −1.3% | +$3.37B |
| 188 |  Iraq |
−$7.62B | −3.0% | +$422M |
| 189 |  Austria |
−$11.7B | −2.0% | −$6.07B |
| 190 |  Belgium |
−$28.8B | −4.0% | −$19.3B |
| 191 |  Luxembourg |
−$33.1B | −32.7% | +$101B |
| 192 |  Hungary |
−$69.9B | −28.4% | −$60.8B |
| Not ranked: latest data before 2020 | ||||
 Syria |
+$804M (2011) | +1.2% | n/a | |
 Liechtenstein |
−$87.2B (2018) | −1,303% | n/a | |
The list ranks 192 countries by their latest net inflows of foreign direct investment: 176 had net inflows and 16 negative net inflows (disinvestment). The largest net inflows were the United States', $307 billion, and the largest negative net inflows Hungary's, $69.9 billion. The world's net inflows were $1.53 trillion in 2025.
Foreign direct investment is investment from abroad that gives the investor a lasting interest in a business, with at least 10% of its voting power: building or buying a factory, buying a stake in a company, or a parent company's loans to its affiliate. Net inflows are the new investment from abroad minus what foreign investors withdrew from the country in the year; they are negative when the withdrawals are larger (disinvestment). The figures are in current US dollars.
Foreign direct investment by country: net inflows, US$, 1990–2025
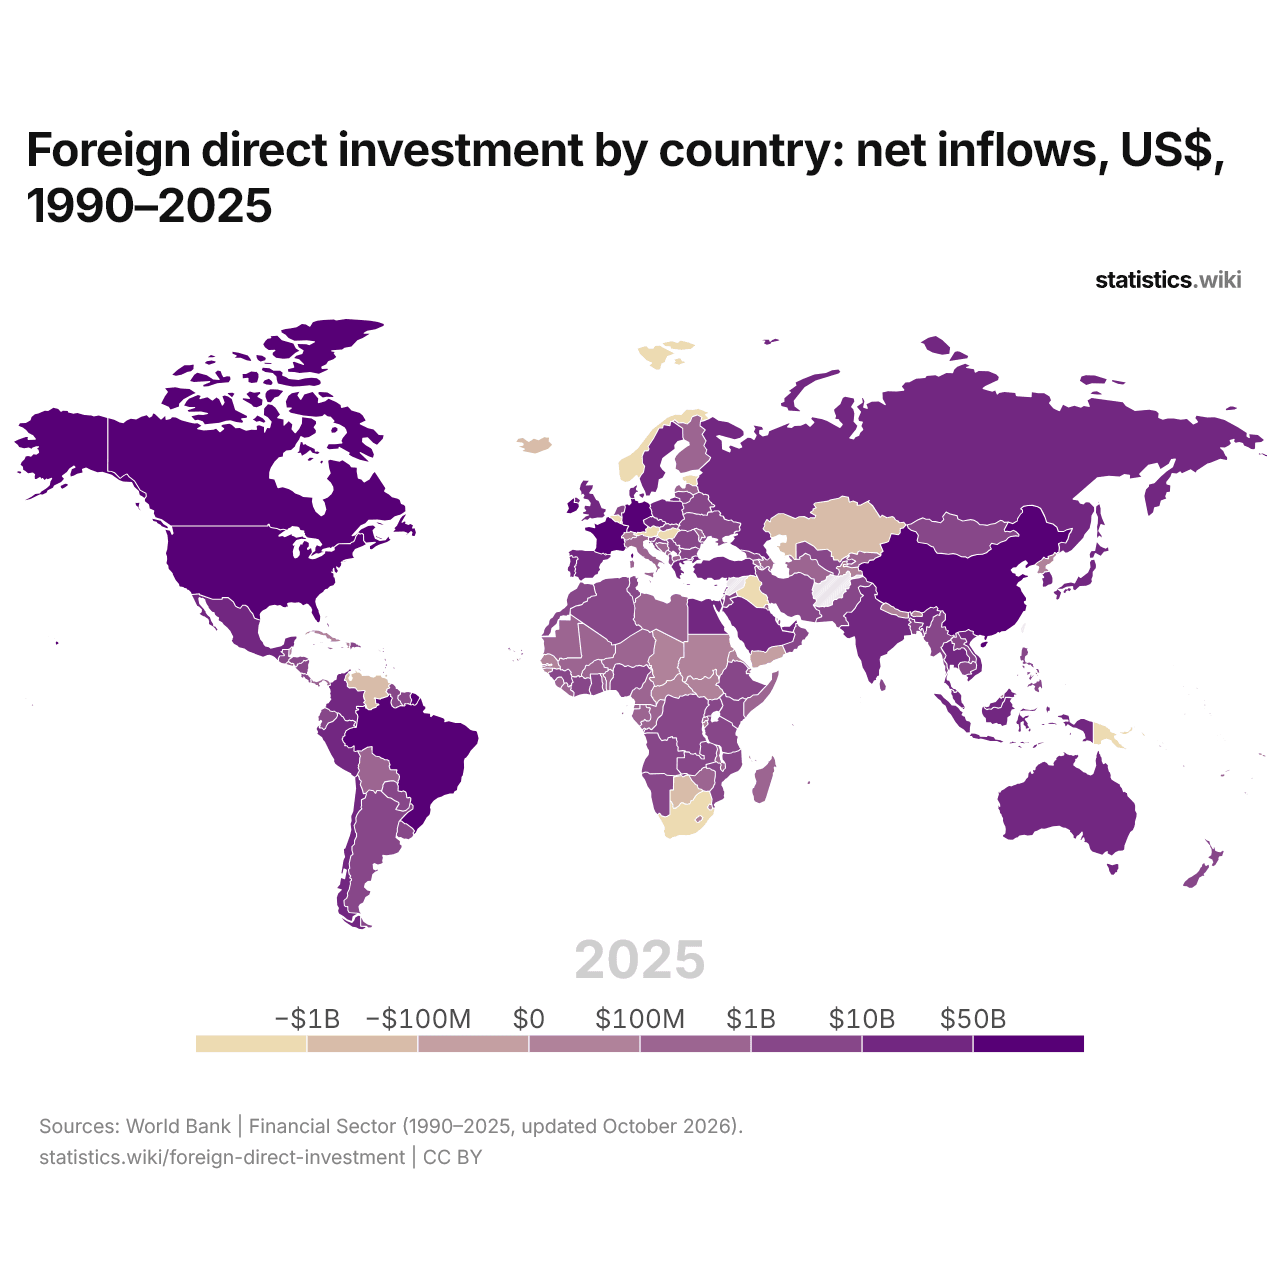
In 2025, 37 countries had net inflows of more than $10 billion and 16 negative net inflows; in 1990, the numbers were 5 and 16.
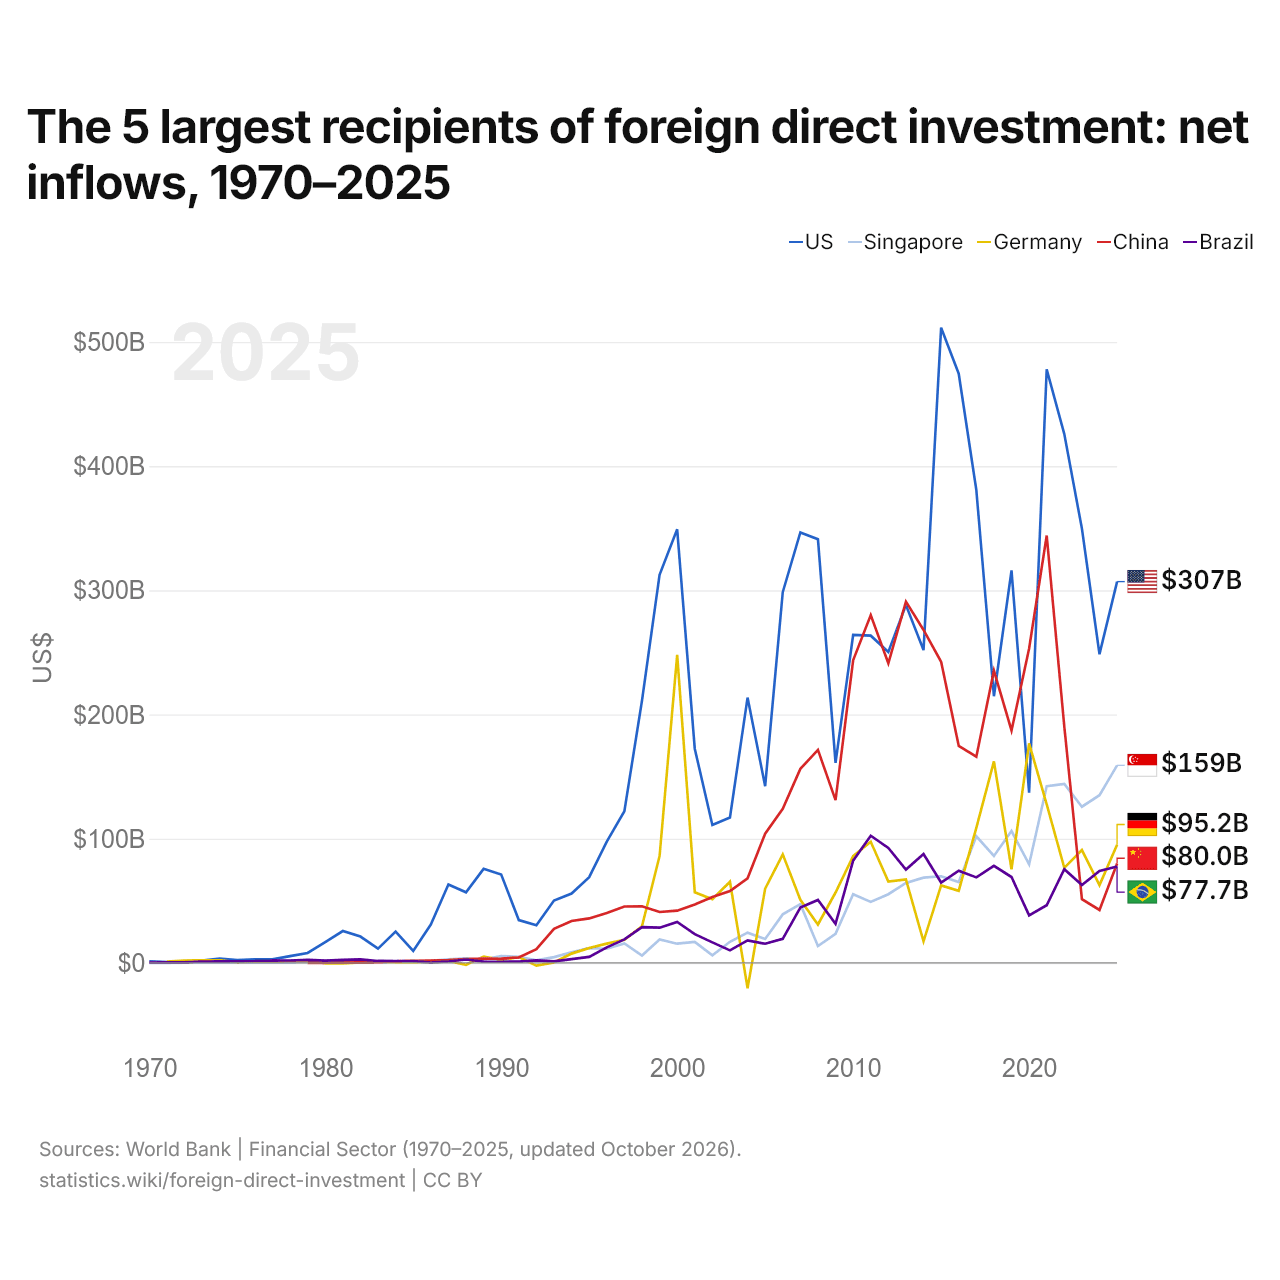
The 5 largest recipients of foreign direct investment: net inflows, 1970–2025
| Year | US$ | ||||
|---|---|---|---|---|---|
| United States | Singapore | Germany | China | Brazil | |
| 2025 | $307,018,000,000 | $159,087,766,263 | $95,190,853,681 | $79,979,865,650 | $77,676,162,912 |
| 2024 | $248,584,000,000 | $135,077,157,183 | $62,637,241,923 | $42,646,542,015 | $74,090,786,050 |
| 2023 | $349,697,000,000 | $125,786,783,507 | $90,884,107,610 | $51,338,076,802 | $62,750,364,285 |
| 2022 | $425,816,000,000 | $144,147,823,985 | $76,571,769,736 | $190,203,789,093 | $75,501,038,733 |
| 2021 | $477,956,000,000 | $142,313,339,702 | $127,609,826,748 | $344,074,977,062 | $46,440,503,520 |
| 2020 | $137,066,000,000 | $79,322,385,229 | $176,781,024,357 | $253,095,616,059 | $38,270,116,307 |
| 2019 | $315,984,000,000 | $106,174,185,548 | $75,463,438,451 | $187,169,822,365 | $69,174,411,753 |
| 2018 | $214,715,000,000 | $86,126,491,249 | $162,250,938,126 | $235,365,050,036 | $78,183,840,045 |
| 2017 | $380,823,000,000 | $101,970,056,303 | $108,786,501,529 | $166,083,755,722 | $68,885,491,315 |
| 2016 | $474,388,000,000 | $65,133,174,223 | $58,132,711,371 | $174,749,584,584 | $74,294,627,801 |
| 2015 | $511,434,000,000 | $69,774,553,125 | $62,418,993,509 | $242,489,331,627 | $64,738,153,494 |
| 2014 | $251,856,000,000 | $68,698,472,831 | $17,356,720,098 | $268,097,181,064 | $87,713,983,217 |
| 2013 | $288,131,000,000 | $64,389,514,904 | $67,199,694,459 | $290,928,431,467 | $75,211,029,129 |
| 2012 | $250,345,000,000 | $55,310,807,548 | $65,443,087,632 | $241,213,868,161 | $92,568,388,321 |
| 2011 | $263,497,000,000 | $49,155,657,316 | $97,535,403,953 | $280,072,219,150 | $102,427,228,231 |
| 2010 | $264,039,000,000 | $55,322,434,162 | $86,037,502,102 | $243,703,434,558 | $82,389,932,468 |
| 2009 | $161,083,000,000 | $23,436,064,060 | $56,701,916,795 | $131,057,052,870 | $31,480,931,700 |
| 2008 | $341,092,000,000 | $13,598,298,537 | $30,954,735,498 | $171,534,650,312 | $50,716,402,711 |
| 2007 | $346,613,000,000 | $47,337,947,783 | $50,847,183,837 | $156,249,335,203 | $44,579,492,464 |
| 2006 | $298,463,000,000 | $39,129,332,047 | $87,444,159,239 | $124,082,035,619 | $19,418,085,598 |
| 2005 | $142,344,000,000 | $19,316,058,814 | $59,835,195,025 | $104,108,693,867 | $15,459,981,604 |
| 2004 | $213,641,000,000 | $24,390,254,966 | $−20,408,419,557 | $68,117,272,181 | $18,161,380,460 |
| 2003 | $117,106,000,000 | $17,051,420,153 | $65,401,516,009 | $57,900,937,467 | $10,123,013,671 |
| 2002 | $111,055,000,000 | $6,157,194,144 | $51,268,214,891 | $53,073,618,897 | $16,586,600,193 |
| 2001 | $172,496,000,000 | $17,006,818,857 | $56,948,542,387 | $47,053,000,000 | $23,225,846,372 |
| 2000 | $349,125,000,000 | $15,515,295,182 | $248,007,397,122 | $42,095,300,000 | $32,994,718,700 |
| 1999 | $312,449,000,000 | $18,852,989,359 | $86,035,665,071 | $41,014,000,000 | $28,385,675,615 |
| 1998 | $211,150,000,000 | $5,958,646,074 | $29,525,738,646 | $45,644,000,000 | $28,855,609,916 |
| 1997 | $122,150,000,000 | $15,701,783,679 | $18,638,428,446 | $45,439,000,000 | $18,992,934,311 |
| 1996 | $97,660,000,000 | $11,432,363,956 | $15,590,587,107 | $40,180,000,000 | $12,552,000,000 |
| 1995 | $69,080,000,000 | $11,942,852,103 | $12,040,789,985 | $35,849,200,000 | $4,859,000,000 |
| 1994 | $55,940,000,000 | $8,550,165,227 | $7,517,424,677 | $33,787,000,000 | $3,072,000,000 |
| 1993 | $50,230,000,000 | $4,686,312,017 | $477,658,764 | $27,515,000,000 | $1,292,000,000 |
| 1992 | $30,310,000,000 | $2,204,342,221 | $−2,137,482,963 | $11,156,000,000 | $2,061,000,000 |
| 1991 | $34,550,000,000 | $4,887,094,440 | $4,741,546,059 | $4,366,000,000 | $1,103,000,000 |
| 1990 | $71,230,000,000 | $5,574,738,855 | $2,556,702,846 | $3,487,000,000 | $989,000,000 |
| 1989 | $75,780,000,000 | $2,886,591,947 | $5,173,426,485 | $3,393,000,000 | $1,131,000,000 |
| 1988 | $56,910,000,000 | $3,654,794,589 | $−1,508,574,621 | $3,194,000,000 | $2,804,000,000 |
| 1987 | $63,235,000,000 | $2,836,204,782 | $1,620,170,657 | $2,314,000,000 | $1,169,000,000 |
| 1986 | $30,946,000,000 | $1,710,283,593 | $1,192,024,600 | $1,875,000,000 | $345,000,000 |
| 1985 | $9,630,000,000 | $1,046,746,813 | $531,108,429 | $1,659,000,000 | $1,441,000,000 |
| 1984 | $25,230,000,000 | $1,301,871,313 | $590,664,407 | $1,258,000,000 | $1,594,000,000 |
| 1983 | $11,500,000,000 | $1,133,905,966 | $997,855,447 | $636,000,000 | $1,609,000,000 |
| 1982 | $21,230,000,000 | $1,601,850,446 | $468,263,695 | $430,000,000 | $2,910,000,000 |
| 1981 | $25,680,000,000 | $1,659,967,735 | $−415,839,560 | $265,000,000 | $2,520,000,000 |
| 1980 | $16,740,000,000 | $1,235,750,842 | $−186,573,401 | $57,000,000 | $1,911,000,000 |
| 1979 | $8,050,000,000 | $836,031,838 | $1,732,552,304 | $80,000 | $2,419,000,000 |
| 1978 | $5,500,000,000 | $299,908,752 | $1,603,458,933 | - | $2,006,000,000 |
| 1977 | $2,920,000,000 | $291,465,114 | $949,983,809 | - | $1,833,000,000 |
| 1976 | $2,910,000,000 | $230,690,622 | $1,321,369,938 | - | $1,555,000,000 |
| 1975 | $2,310,000,000 | $291,823,051 | $690,496,823 | - | $1,302,000,000 |
| 1974 | $3,540,000,000 | $340,190,956 | $2,176,992,344 | - | $1,207,900,000 |
| 1973 | $1,930,000,000 | $352,816,701 | $2,102,302,343 | - | $1,180,700,000 |
| 1972 | $1,270,000,000 | $161,066,667 | $1,897,270,696 | - | $459,900,000 |
| 1971 | $770,000,000 | $116,000,000 | $1,103,338,755 | - | $449,000,000 |
| 1970 | $1,220,000,000 | $93,000,000 | - | - | $391,700,000 |
In 2025, net inflows of foreign direct investment were $307 billion in the United States, $159 billion in Singapore, $95.2 billion in Germany, $80 billion in China and $77.7 billion in Brazil. The United States' net inflows have been the largest of the five since 2021. The most recent change in their order came in 2025, when China passed Brazil.
The 10 countries with the largest FDI net inflows, 2025
The 10 countries with the largest negative FDI net inflows (disinvestment), 2025
In 2025, the ten largest net inflows added up to $1.02 trillion and the ten largest negative net inflows to $163 billion.
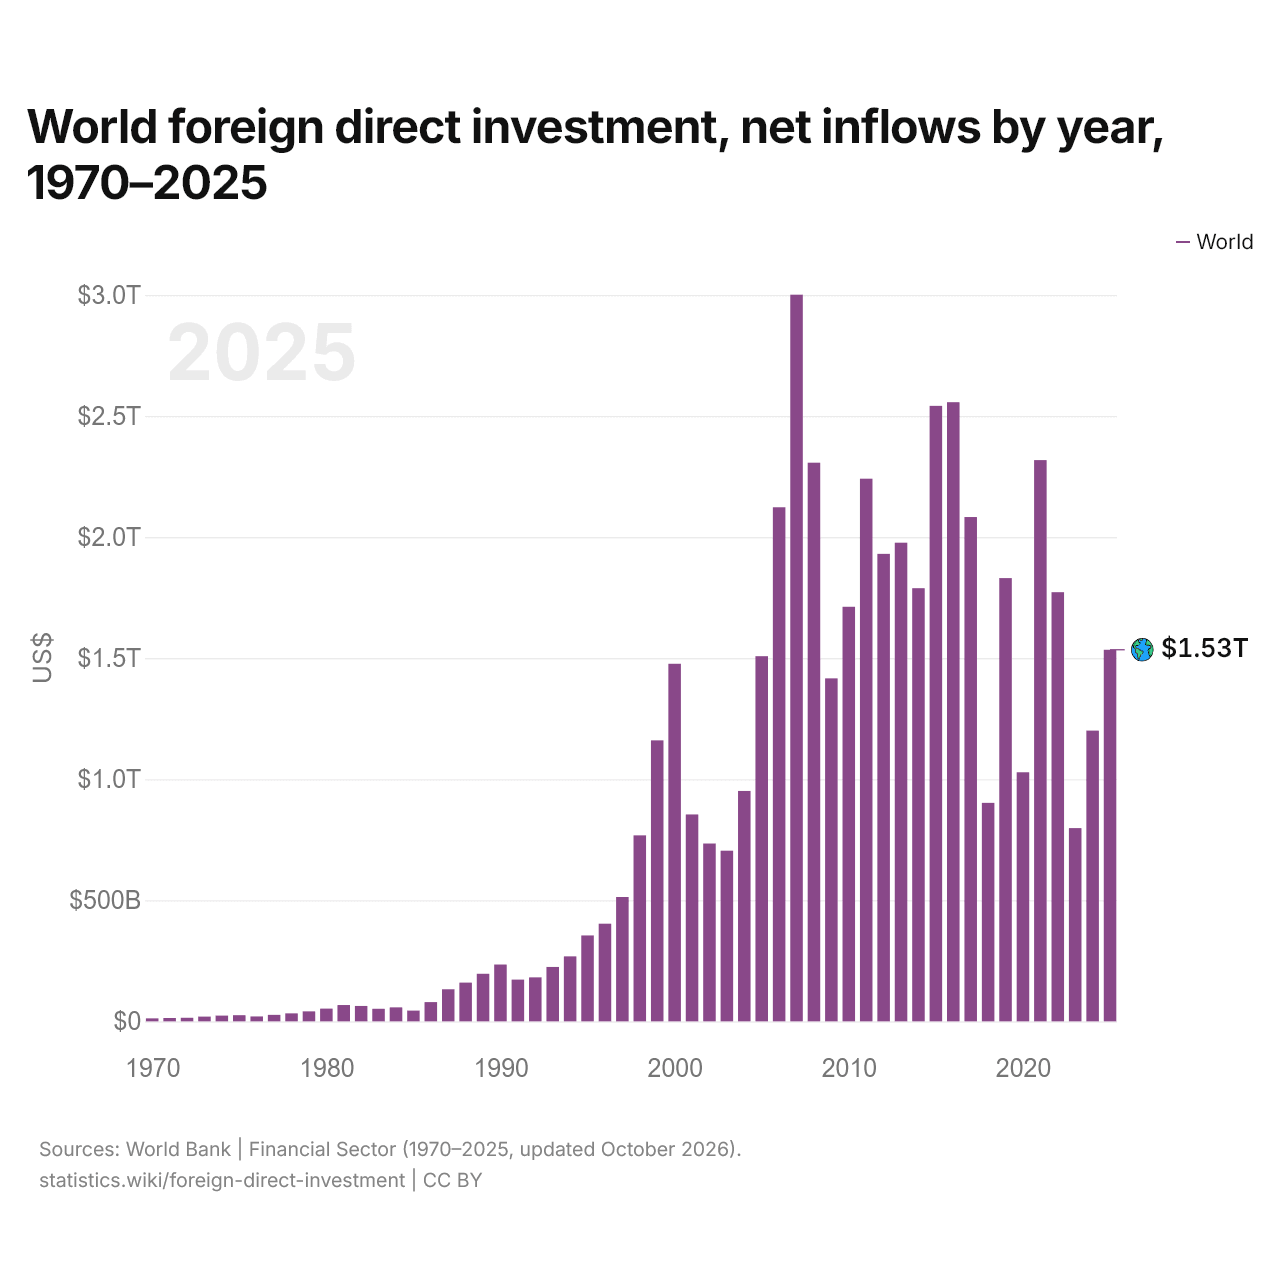
World foreign direct investment, net inflows by year, 1970–2025
| Year | US$ |
|---|---|
| World | |
| 2025 | $1,534,510,120,303 |
| 2024 | $1,200,677,283,296 |
| 2023 | $798,025,771,127 |
| 2022 | $1,772,301,112,748 |
| 2021 | $2,317,806,015,643 |
| 2020 | $1,028,734,655,036 |
| 2019 | $1,830,554,522,165 |
| 2018 | $902,248,732,986 |
| 2017 | $2,082,622,016,826 |
| 2016 | $2,556,851,727,544 |
| 2015 | $2,541,753,938,430 |
| 2014 | $1,788,720,278,181 |
| 2013 | $1,976,581,228,226 |
| 2012 | $1,930,592,924,609 |
| 2011 | $2,240,969,844,320 |
| 2010 | $1,712,112,939,479 |
| 2009 | $1,416,353,294,875 |
| 2008 | $2,307,217,654,439 |
| 2007 | $3,000,983,517,073 |
| 2006 | $2,123,089,240,995 |
| 2005 | $1,507,954,192,493 |
| 2004 | $951,536,264,473 |
| 2003 | $704,688,980,225 |
| 2002 | $734,438,029,253 |
| 2001 | $854,327,943,736 |
| 2000 | $1,476,645,233,628 |
| 1999 | $1,160,364,667,662 |
| 1998 | $768,098,061,093 |
| 1997 | $513,503,450,975 |
| 1996 | $403,130,871,267 |
| 1995 | $354,710,041,329 |
| 1994 | $268,185,232,833 |
| 1993 | $224,678,715,753 |
| 1992 | $181,526,387,451 |
| 1991 | $172,434,592,172 |
| 1990 | $234,587,215,488 |
| 1989 | $196,304,532,880 |
| 1988 | $159,897,369,962 |
| 1987 | $132,428,906,437 |
| 1986 | $79,514,232,384 |
| 1985 | $44,393,571,346 |
| 1984 | $57,602,849,040 |
| 1983 | $51,721,885,231 |
| 1982 | $63,450,151,143 |
| 1981 | $67,249,479,806 |
| 1980 | $52,506,178,760 |
| 1979 | $41,058,477,123 |
| 1978 | $33,006,982,349 |
| 1977 | $26,708,782,264 |
| 1976 | $20,185,020,716 |
| 1975 | $25,387,934,265 |
| 1974 | $23,824,304,290 |
| 1973 | $19,698,106,177 |
| 1972 | $14,601,160,456 |
| 1971 | $13,865,341,683 |
| 1970 | $12,213,763,755 |
The world's net inflows of foreign direct investment were $1.53 trillion in 2025, compared with $12.2 billion in 1970. They fell from the year before in 17 of the 55 years since 1970, most recently in 2023.
Compare the foreign direct investment of any 2 countries
Sources:
- World Bank | Financial Sector (1970–2025, updated October 2026)
Creative Commons Attribution (CC BY): you may copy, share, adapt and reuse this content, also commercially, as long as you credit statistics.wiki and note any changes you made. The sources listed above may have their own license terms.