
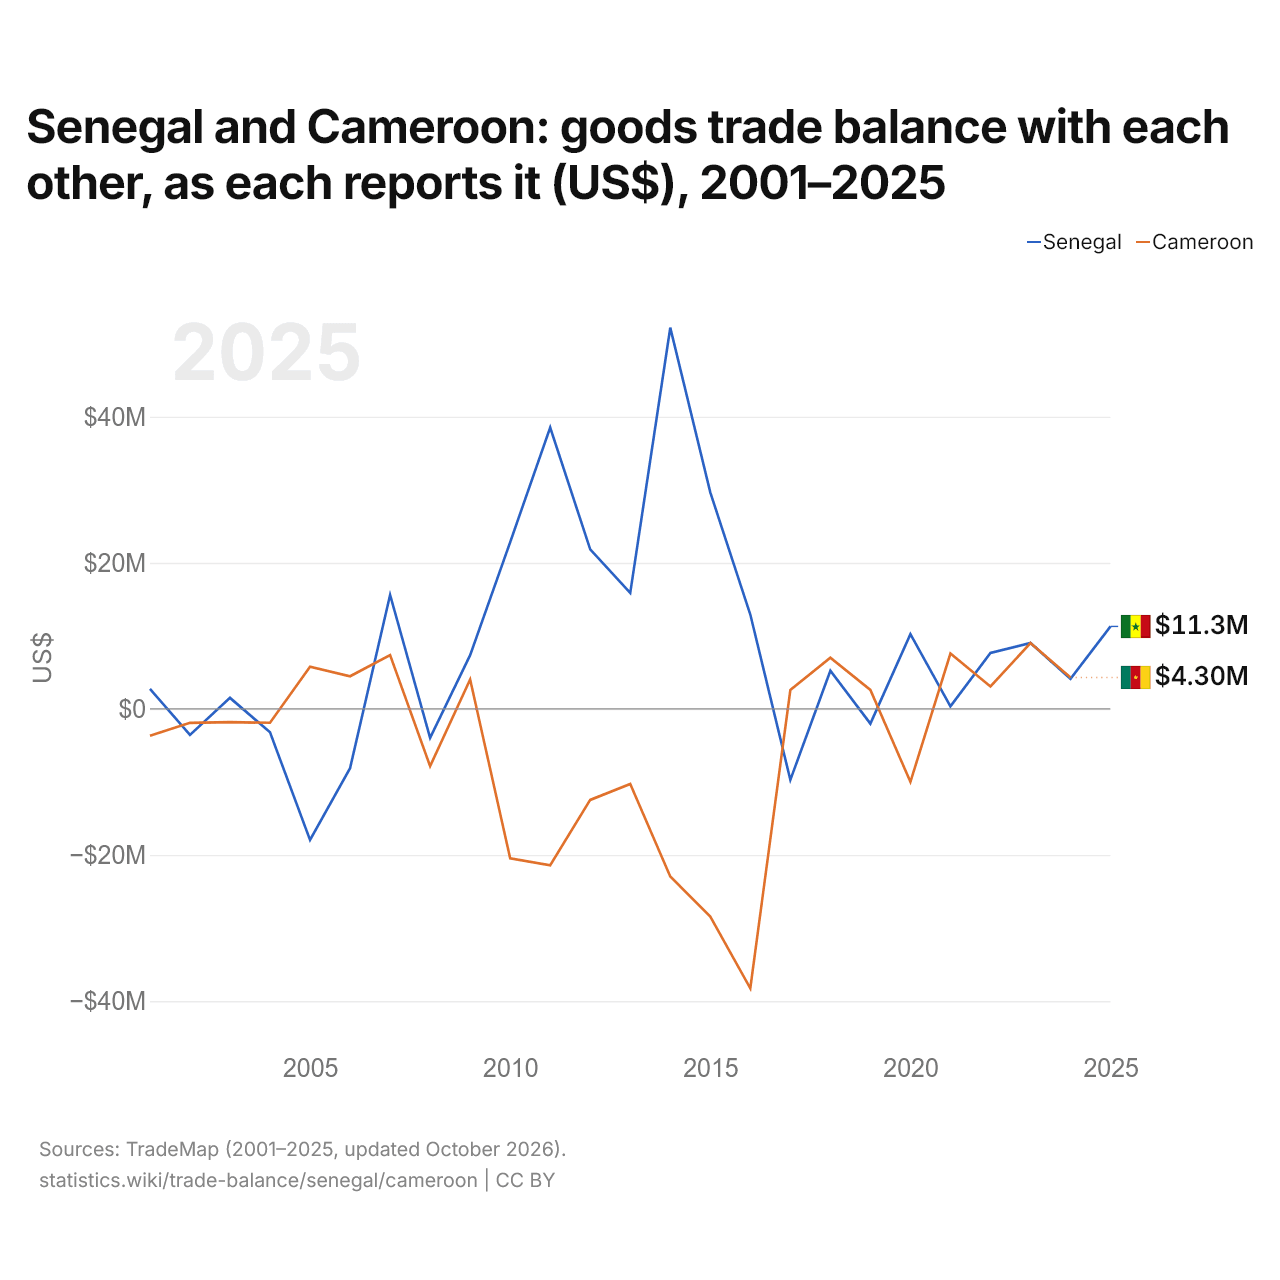
O Senegal e Camarões: saldo do comércio de bens entre os dois, segundo cada um (US$), 2001–2025
| Ano | US$ | |
|---|---|---|
| Senegal | Camarões | |
| 2025 | US$ 11.287.000 | - |
| 2024 | US$ 4.116.000 | US$ 4.299.000 |
| 2023 | US$ 9.033.000 | US$ 9.016.000 |
| 2022 | US$ 7.672.000 | US$ 3.066.000 |
| 2021 | US$ 356.000 | US$ 7.581.000 |
| 2020 | US$ 10.236.000 | US$ −9.988.000 |
| 2019 | US$ −2.019.000 | US$ 2.592.000 |
| 2018 | US$ 5.222.000 | US$ 7.023.000 |
| 2017 | US$ −9.715.000 | US$ 2.579.000 |
| 2016 | US$ 12.918.000 | US$ −38.249.000 |
| 2015 | US$ 29.630.000 | US$ −28.422.000 |
| 2014 | US$ 52.183.000 | US$ −22.950.000 |
| 2013 | US$ 15.881.000 | US$ −10.275.000 |
| 2012 | US$ 21.838.000 | US$ −12.457.000 |
| 2011 | US$ 38.525.000 | US$ −21.411.000 |
| 2010 | US$ 22.824.000 | US$ −20.448.000 |
| 2009 | US$ 7.348.000 | US$ 4.038.000 |
| 2008 | US$ −3.971.000 | US$ −7.840.000 |
| 2007 | US$ 15.609.000 | US$ 7.364.000 |
| 2006 | US$ −8.109.000 | US$ 4.462.000 |
| 2005 | US$ −17.949.000 | US$ 5.783.000 |
| 2004 | US$ −3.209.000 | US$ −1.894.000 |
| 2003 | US$ 1.509.000 | US$ −1.821.000 |
| 2002 | US$ −3.565.000 | US$ −1.907.000 |
| 2001 | US$ 2.735.000 | US$ −3.679.000 |
Segundo o Senegal, o seu comércio de bens com Camarões teve um superávit de US$ 4,12 milhões; segundo Camarões, o seu comércio de bens com o Senegal teve um superávit de US$ 4,3 milhões. Em 2001, os valores foram um superávit de US$ 2,74 milhões do Senegal e um déficit de US$ 3,68 milhões de Camarões.
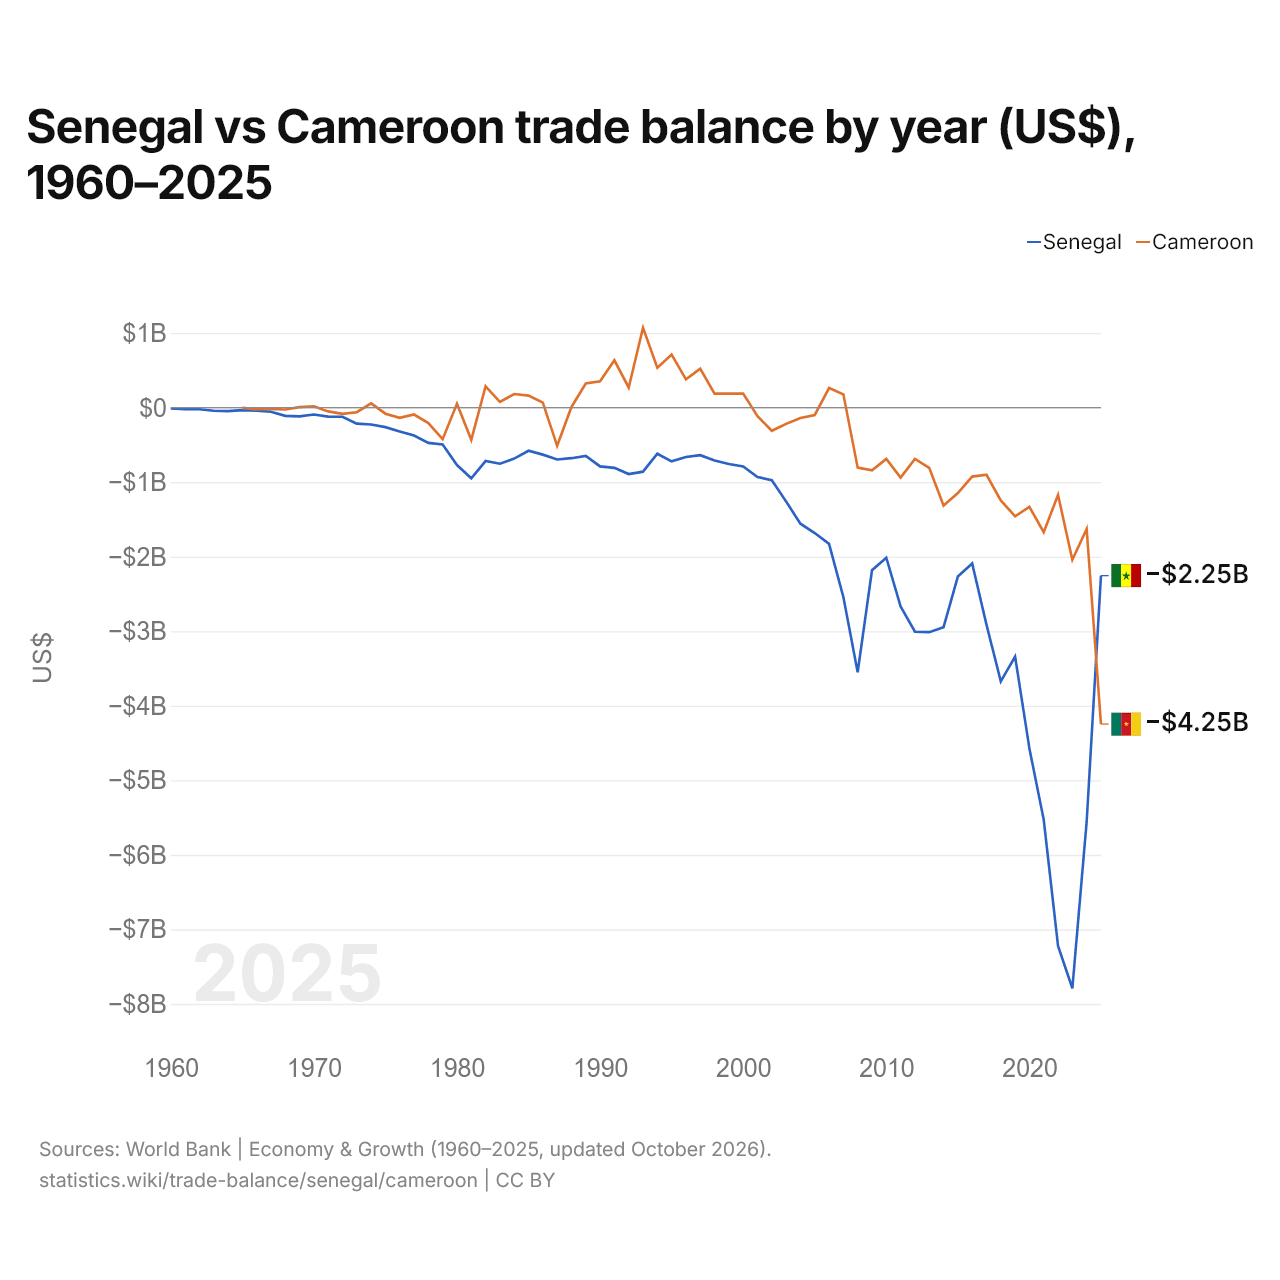
Senegal vs Camarões: balança comercial por ano (US$), 1960–2025
| Ano | US$ | |
|---|---|---|
 Senegal |
 Camarões |
|
| 2025 | US$ −2.254.797.009 | US$ −4.246.726.670 |
| 2024 | US$ −5.556.418.686 | US$ −1.629.104.742 |
| 2023 | US$ −7.791.145.070 | US$ −2.042.798.870 |
| 2022 | US$ −7.223.414.542 | US$ −1.172.085.979 |
| 2021 | US$ −5.530.794.126 | US$ −1.671.323.232 |
| 2020 | US$ −4.573.902.036 | US$ −1.332.207.513 |
| 2019 | US$ −3.339.746.065 | US$ −1.459.111.721 |
| 2018 | US$ −3.673.626.811 | US$ −1.244.653.784 |
| 2017 | US$ −2.912.156.243 | US$ −901.317.345 |
| 2016 | US$ −2.091.854.968 | US$ −926.064.462 |
| 2015 | US$ −2.267.340.116 | US$ −1.147.279.402 |
| 2014 | US$ −2.947.006.377 | US$ −1.314.441.456 |
| 2013 | US$ −3.013.229.510 | US$ −808.245.361 |
| 2012 | US$ −3.007.037.843 | US$ −688.308.910 |
| 2011 | US$ −2.666.759.217 | US$ −938.106.663 |
| 2010 | US$ −2.014.419.287 | US$ −687.908.926 |
| 2009 | US$ −2.182.849.884 | US$ −841.139.052 |
| 2008 | US$ −3.550.995.270 | US$ −805.869.365 |
| 2007 | US$ −2.541.703.824 | US$ 177.450.170 |
| 2006 | US$ −1.828.626.595 | US$ 262.166.380 |
| 2005 | US$ −1.683.277.737 | US$ −98.869.795 |
| 2004 | US$ −1.557.460.427 | US$ −139.802.528 |
| 2003 | US$ −1.261.395.199 | US$ −218.692.651 |
| 2002 | US$ −974.628.352 | US$ −311.599.250 |
| 2001 | US$ −931.869.615 | US$ −114.993.489 |
| 2000 | US$ −790.841.496 | US$ 188.685.422 |
| 1999 | US$ −756.643.008 | US$ 187.230.061 |
| 1998 | US$ −710.981.169 | US$ 187.969.065 |
| 1997 | US$ −638.913.995 | US$ 521.311.608 |
| 1996 | US$ −662.800.004 | US$ 378.219.990 |
| 1995 | US$ −721.942.267 | US$ 712.153.596 |
| 1994 | US$ −619.015.529 | US$ 534.228.680 |
| 1993 | US$ −859.567.455 | US$ 1.071.655.488 |
| 1992 | US$ −891.875.573 | US$ 269.375.911 |
| 1991 | US$ −809.060.511 | US$ 634.513.723 |
| 1990 | US$ −789.138.069 | US$ 353.349.715 |
| 1989 | US$ −648.670.937 | US$ 323.503.987 |
| 1988 | US$ −679.173.799 | US$ 8.729.311 |
| 1987 | US$ −696.557.973 | US$ −513.084.235 |
| 1986 | US$ −631.025.055 | US$ 66.035.998 |
| 1985 | US$ −579.136.969 | US$ 160.040.348 |
| 1984 | US$ −684.767.651 | US$ 181.713.955 |
| 1983 | US$ −753.290.508 | US$ 75.161.065 |
| 1982 | US$ −717.190.201 | US$ 284.501.001 |
| 1981 | US$ −948.392.499 | US$ −432.822.893 |
| 1980 | US$ −770.399.675 | US$ 50.283.352 |
| 1979 | US$ −494.994.369 | US$ −424.028.384 |
| 1978 | US$ −473.309.897 | US$ −208.281.737 |
| 1977 | US$ −373.799.193 | US$ −93.210.794 |
| 1976 | US$ −320.390.929 | US$ −136.848.457 |
| 1975 | US$ −262.727.395 | US$ −81.656.289 |
| 1974 | US$ −226.833.335 | US$ 56.916.211 |
| 1973 | US$ −215.838.572 | US$ −62.811.432 |
| 1972 | US$ −123.162.898 | US$ −85.308.670 |
| 1971 | US$ −120.905.431 | US$ −51.207.085 |
| 1970 | US$ −92.890.198 | US$ 17.727.714 |
| 1969 | US$ −118.713.214 | US$ 5.770.107 |
| 1968 | US$ −111.762.720 | US$ −26.255.762 |
| 1967 | US$ −55.530.284 | US$ −18.292.600 |
| 1966 | US$ −40.275.417 | US$ −21.979.995 |
| 1965 | US$ −35.260.894 | US$ −4.080.624 |
| 1964 | US$ −48.291.449 | - |
| 1963 | US$ −42.274.775 | - |
| 1962 | US$ −21.958.734 | - |
| 1961 | US$ −20.976.979 | - |
| 1960 | US$ −10.732.057 | - |
Em 2025, a balança comercial do Senegal teve um déficit de US$ 2,25 bilhões e a de Camarões, um déficit de US$ 4,25 bilhões; o déficit de Camarões foi 1,9 vezes maior. Em 1965, a balança comercial do Senegal teve um déficit de US$ 35,3 milhões e a de Camarões, um déficit de US$ 4,08 milhões.
De 1965 a 2025, a balança comercial do Senegal teve superávit em nenhum dos 61 anos, e a de Camarões, em 24. As balanças comerciais do Senegal e de Camarões tiveram déficit ao mesmo tempo em 37 desses anos, o mais recente em 2025.
Senegal vs Camarões: dados da balança comercial
|
Senegal
|
Camarões
|
|
|---|---|---|
| Bens e serviços, US$ | -US$ 2,25 bi (2025) | -US$ 4,25 bi (2025) |
| % do PIB | −6,1% (2025) | −7,2% (2025) |
| Anos com superávit desde 2000 | 0 de 26 | 3 de 26 |
| Saldo de bens entre os dois, dados próprios | +US$ 11,3 mi (2025) | +US$ 4,30 mi (2024) |
| Maior superávit em bens com | Mali (+US$ 1,59 bi, 2025) | Países Baixos (+US$ 897 mi, 2024) |
| Maior déficit em bens com | França (-US$ 932 mi, 2025) | China (-US$ 944 mi, 2024) |
Comparar a balança comercial de 2 países quaisquer
Fontes:
- Banco Mundial | Economy & Growth (1960–2025, atualizado em outubro de 2026)
- TradeMap (2001–2025, atualizado em outubro de 2026)
Creative Commons Atribuição (CC BY): você pode copiar, compartilhar, adaptar e reutilizar este conteúdo, inclusive para fins comerciais, desde que cite o statistics.wiki e indique as alterações que fizer. As fontes listadas acima podem ter suas próprias condições de licença.