
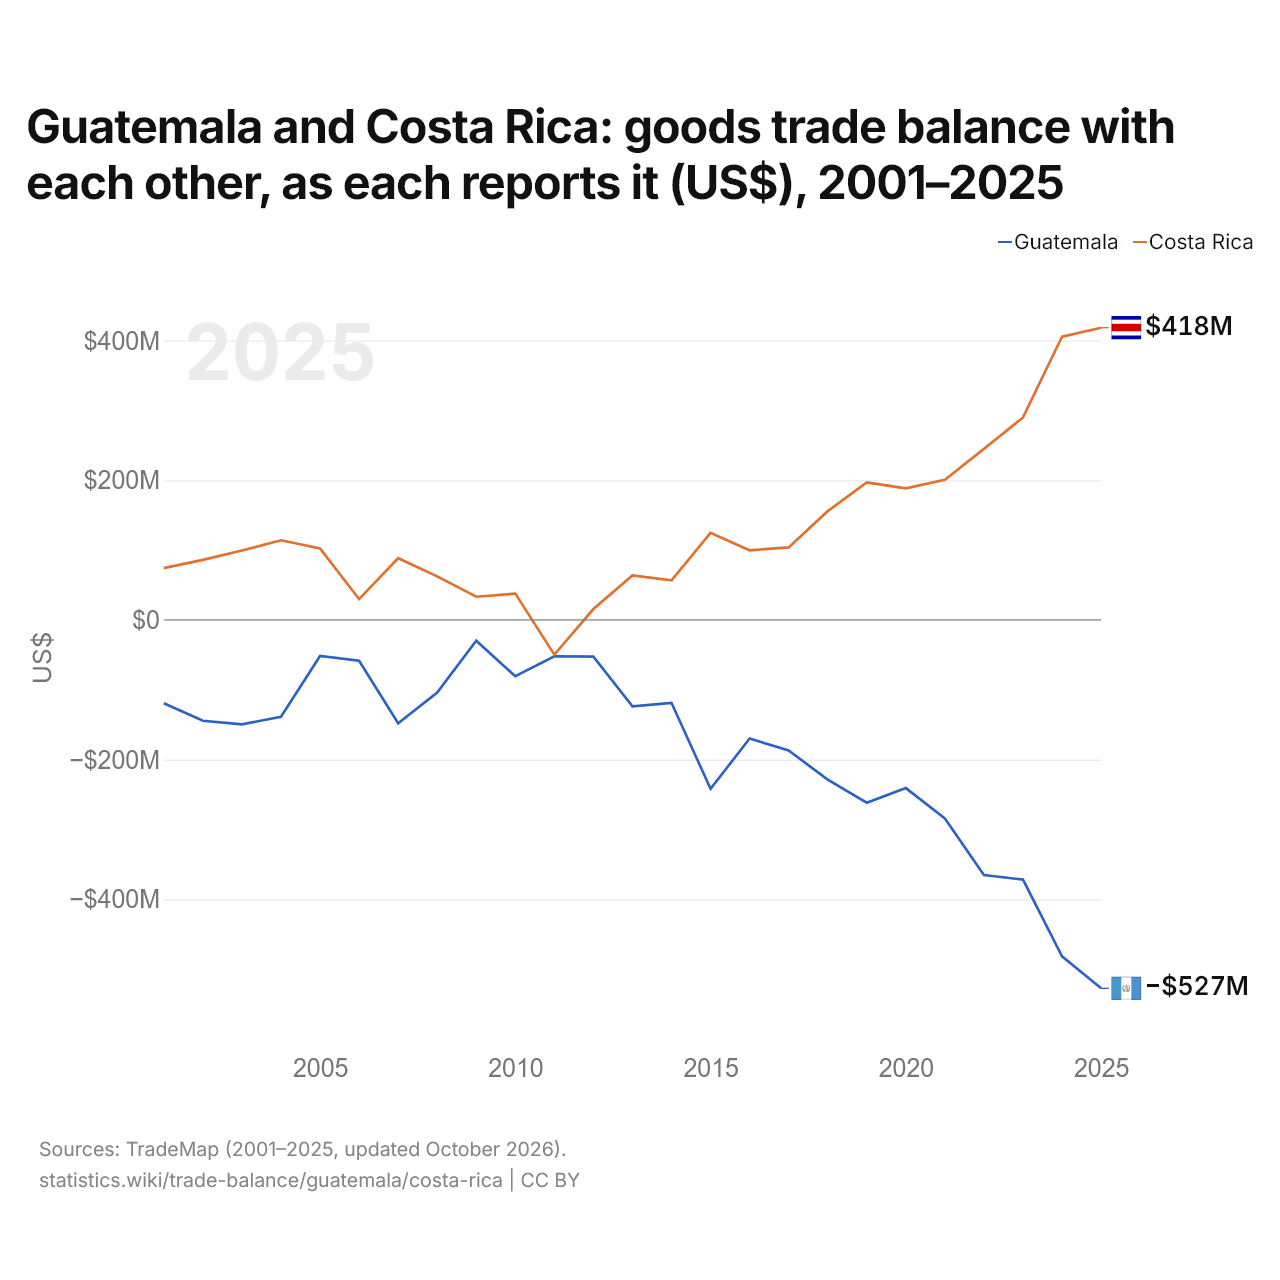
A Guatemala e a Costa Rica: saldo do comércio de bens entre os dois, segundo cada um (US$), 2001–2025
| Ano | US$ | |
|---|---|---|
| Guatemala | Costa Rica | |
| 2025 | US$ −527.411.000 | US$ 418.372.000 |
| 2024 | US$ −481.740.000 | US$ 405.655.000 |
| 2023 | US$ −371.770.000 | US$ 289.879.000 |
| 2022 | US$ −365.199.000 | US$ 244.955.000 |
| 2021 | US$ −284.116.000 | US$ 200.671.000 |
| 2020 | US$ −240.797.000 | US$ 188.376.000 |
| 2019 | US$ −261.692.000 | US$ 196.784.000 |
| 2018 | US$ −228.743.000 | US$ 155.716.000 |
| 2017 | US$ −186.923.000 | US$ 103.854.000 |
| 2016 | US$ −169.811.000 | US$ 99.647.000 |
| 2015 | US$ −241.847.000 | US$ 124.685.000 |
| 2014 | US$ −118.700.000 | US$ 56.510.000 |
| 2013 | US$ −123.629.000 | US$ 63.605.000 |
| 2012 | US$ −52.480.000 | US$ 15.521.000 |
| 2011 | US$ −52.007.000 | US$ −49.745.000 |
| 2010 | US$ −80.681.000 | US$ 37.641.000 |
| 2009 | US$ −29.664.000 | US$ 33.221.000 |
| 2008 | US$ −103.900.000 | US$ 62.310.000 |
| 2007 | US$ −147.928.000 | US$ 88.356.000 |
| 2006 | US$ −58.456.000 | US$ 29.779.000 |
| 2005 | US$ −51.579.000 | US$ 102.269.000 |
| 2004 | US$ −138.620.000 | US$ 114.052.000 |
| 2003 | US$ −149.530.000 | US$ 99.492.000 |
| 2002 | US$ −144.322.000 | US$ 85.955.000 |
| 2001 | US$ −119.233.000 | US$ 74.219.000 |
Em 2025, segundo a Guatemala, o seu comércio de bens com a Costa Rica teve um déficit de US$ 527 milhões; segundo a Costa Rica, o seu comércio de bens com a Guatemala teve um superávit de US$ 418 milhões. Em 2001, os valores foram um déficit de US$ 119 milhões da Guatemala e um superávit de US$ 74,2 milhões da Costa Rica.
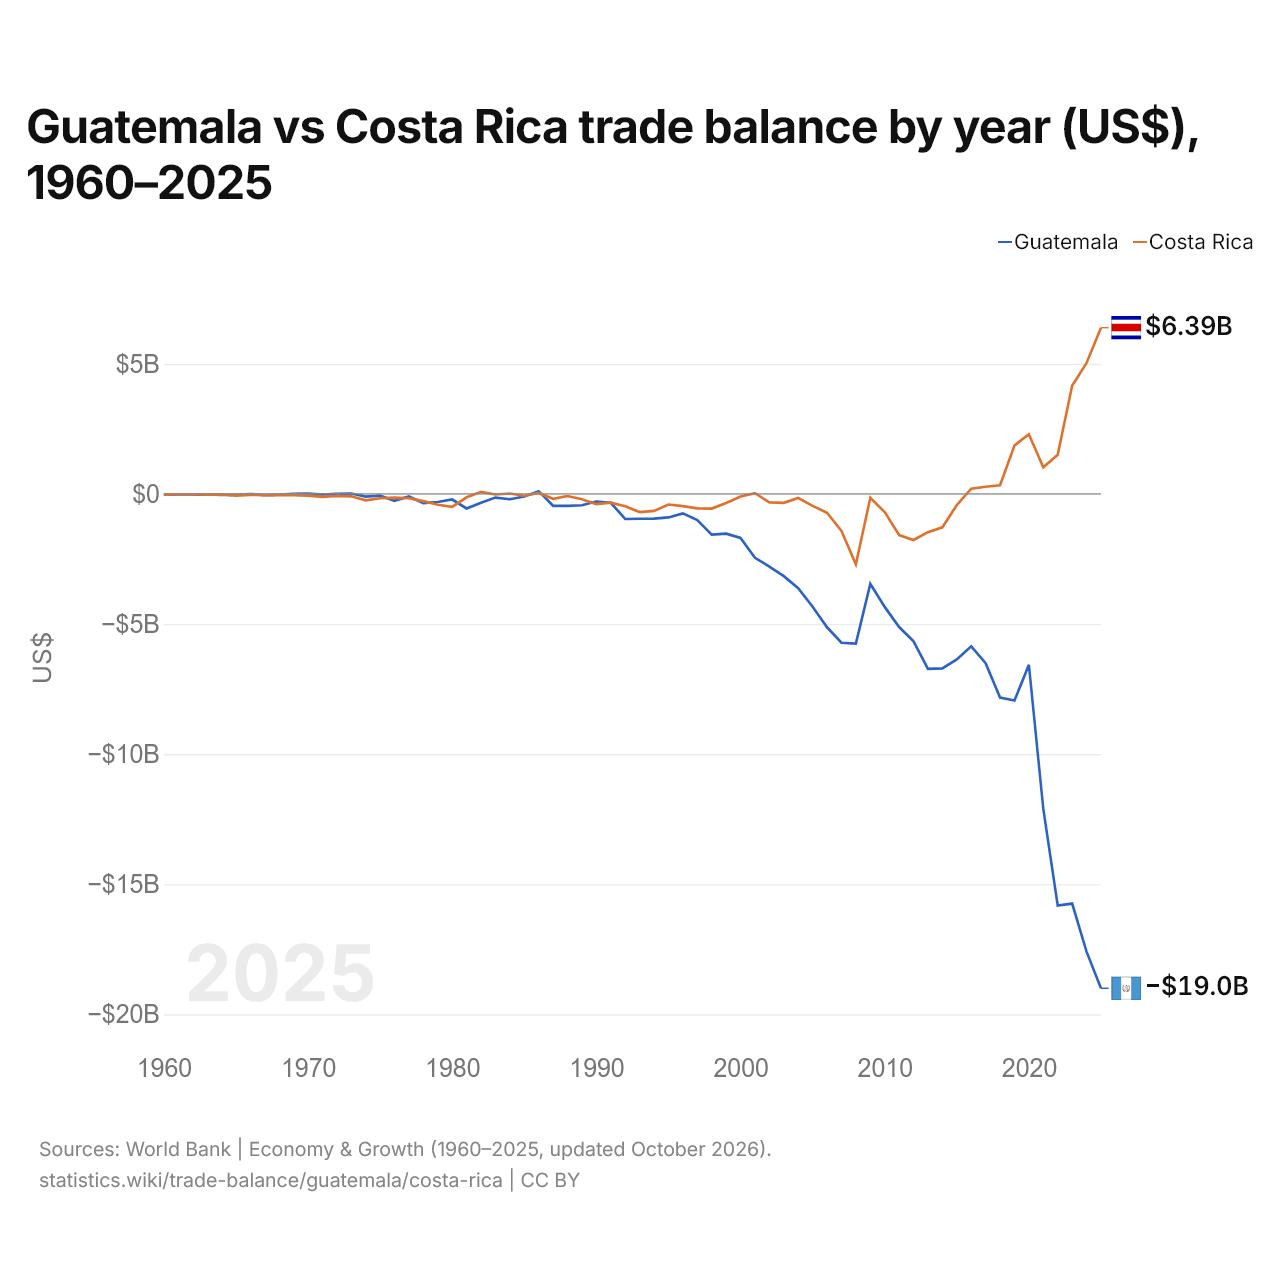
Guatemala vs Costa Rica: balança comercial por ano (US$), 1960–2025
| Ano | US$ | |
|---|---|---|
 Guatemala |
 Costa Rica |
|
| 2025 | US$ −19.000.550.382 | US$ 6.388.241.982 |
| 2024 | US$ −17.591.856.739 | US$ 5.035.307.503 |
| 2023 | US$ −15.743.603.592 | US$ 4.159.883.783 |
| 2022 | US$ −15.819.132.051 | US$ 1.508.939.813 |
| 2021 | US$ −12.105.359.985 | US$ 1.020.579.727 |
| 2020 | US$ −6.570.043.061 | US$ 2.291.858.848 |
| 2019 | US$ −7.943.184.987 | US$ 1.861.743.506 |
| 2018 | US$ −7.826.360.108 | US$ 331.875.262 |
| 2017 | US$ −6.505.679.348 | US$ 274.387.327 |
| 2016 | US$ −5.856.664.075 | US$ 201.088.459 |
| 2015 | US$ −6.363.896.711 | US$ −430.226.387 |
| 2014 | US$ −6.707.698.798 | US$ −1.282.418.430 |
| 2013 | US$ −6.724.671.222 | US$ −1.468.936.015 |
| 2012 | US$ −5.666.222.525 | US$ −1.769.252.761 |
| 2011 | US$ −5.114.940.803 | US$ −1.579.738.366 |
| 2010 | US$ −4.341.925.329 | US$ −697.914.668 |
| 2009 | US$ −3.454.600.723 | US$ −152.101.398 |
| 2008 | US$ −5.748.620.323 | US$ −2.707.039.847 |
| 2007 | US$ −5.720.072.253 | US$ −1.422.824.731 |
| 2006 | US$ −5.125.605.018 | US$ −723.827.090 |
| 2005 | US$ −4.337.274.363 | US$ −459.655.981 |
| 2004 | US$ −3.625.257.837 | US$ −156.546.480 |
| 2003 | US$ −3.158.808.057 | US$ −342.720.363 |
| 2002 | US$ −2.791.095.734 | US$ −325.752.876 |
| 2001 | US$ −2.455.612.818 | US$ 26.262.657 |
| 2000 | US$ −1.688.845.868 | US$ −99.732.308 |
| 1999 | US$ −1.529.708.069 | US$ −345.378.745 |
| 1998 | US$ −1.567.257.913 | US$ −562.742.719 |
| 1997 | US$ −1.003.310.355 | US$ −554.419.175 |
| 1996 | US$ −748.115.757 | US$ −471.011.506 |
| 1995 | US$ −904.435.170 | US$ −407.096.810 |
| 1994 | US$ −951.801.198 | US$ −653.309.769 |
| 1993 | US$ −954.508.166 | US$ −696.116.962 |
| 1992 | US$ −963.712.352 | US$ −474.694.622 |
| 1991 | US$ −340.035.952 | US$ −333.904.177 |
| 1990 | US$ −291.812.443 | US$ −394.370.767 |
| 1989 | US$ −434.552.557 | US$ −203.773.887 |
| 1988 | US$ −457.366.450 | US$ −82.456.788 |
| 1987 | US$ −456.599.960 | US$ −187.400.032 |
| 1986 | US$ 105.570.776 | US$ 37.374.552 |
| 1985 | US$ −100.695.565 | US$ −68.700.990 |
| 1984 | US$ −203.500.000 | US$ 15.024.920 |
| 1983 | US$ −140.999.900 | US$ −23.463.184 |
| 1982 | US$ −340.000.000 | US$ 76.088.041 |
| 1981 | US$ −560.499.900 | US$ −128.771.636 |
| 1980 | US$ −215.300.000 | US$ −499.626.604 |
| 1979 | US$ −310.800.000 | US$ −414.469.078 |
| 1978 | US$ −351.300.100 | US$ −276.581.097 |
| 1977 | US$ −98.700.100 | US$ −167.934.656 |
| 1976 | US$ −262.400.000 | US$ −144.795.799 |
| 1975 | US$ −66.000.000 | US$ −166.394.399 |
| 1974 | US$ −103.000.000 | US$ −249.609.079 |
| 1973 | US$ 17.400.000 | US$ −92.857.300 |
| 1972 | US$ 7.800.000 | US$ −78.975.132 |
| 1971 | US$ −28.000.000 | US$ −111.065.280 |
| 1970 | US$ 15.100.000 | US$ −66.415.094 |
| 1969 | US$ 6.400.000 | US$ −45.720.755 |
| 1968 | US$ −27.100.000 | US$ −36.286.792 |
| 1967 | US$ −48.000.000 | US$ −44.332.075 |
| 1966 | US$ −2.700.000 | US$ −38.792.453 |
| 1965 | US$ −37.600.000 | US$ −63.003.774 |
| 1964 | US$ −35.100.000 | US$ −22.510.940 |
| 1963 | US$ −20.800.000 | US$ −25.804.123 |
| 1962 | US$ −18.700.000 | US$ −15.939.610 |
| 1961 | US$ −16.600.000 | US$ −20.571.792 |
| 1960 | US$ −19.800.000 | US$ −24.821.248 |
Em 2025, a balança comercial da Guatemala teve um déficit de US$ 19 bilhões e a da Costa Rica, um superávit de US$ 6,39 bilhões. Em 1960, a balança comercial da Guatemala teve um déficit de US$ 19,8 milhões e a da Costa Rica, um déficit de US$ 24,8 milhões.
De 1960 a 2025, a balança comercial da Guatemala teve superávit em 5 dos 66 anos, e a da Costa Rica, em 14. As balanças comerciais da Guatemala e da Costa Rica tiveram déficit ao mesmo tempo em 48 desses anos, o mais recente em 2015.
Guatemala vs Costa Rica: dados da balança comercial
|
Guatemala
|
Costa Rica
|
|
|---|---|---|
| Bens e serviços, US$ | -US$ 19,0 bi (2025) | +US$ 6,39 bi (2025) |
| % do PIB | −15,4% (2025) | +6,2% (2025) |
| Anos com superávit desde 2000 | 0 de 26 | 11 de 26 |
| Saldo de bens entre os dois, dados próprios | -US$ 527 mi (2025) | +US$ 418 mi (2025) |
| Maior superávit em bens com | Nicarágua (+US$ 911 mi, 2025) | Países Baixos (+US$ 1,97 bi, 2025) |
| Maior déficit em bens com | Estados Unidos (-US$ 6,09 bi, 2025) | China (-US$ 4,18 bi, 2025) |
Comparar a balança comercial de 2 países quaisquer
Fontes:
- Banco Mundial | Economy & Growth (1960–2025, atualizado em outubro de 2026)
- TradeMap (2001–2025, atualizado em outubro de 2026)
Creative Commons Atribuição (CC BY): você pode copiar, compartilhar, adaptar e reutilizar este conteúdo, inclusive para fins comerciais, desde que cite o statistics.wiki e indique as alterações que fizer. As fontes listadas acima podem ter suas próprias condições de licença.