
Ruanda vs Portugal: gastos militares (US$), 1960–2025
| Ano | US$ | |
|---|---|---|
 Ruanda |
 Portugal |
|
| 2025 | US$ 210.579.140 | US$ 5.931.729.151 |
| 2024 | US$ 185.897.928 | US$ 4.529.704.001 |
| 2023 | US$ 185.424.217 | US$ 3.531.855.845 |
| 2022 | US$ 183.316.934 | US$ 3.488.539.557 |
| 2021 | US$ 170.163.659 | US$ 3.881.044.054 |
| 2020 | US$ 154.550.725 | US$ 3.298.548.143 |
| 2019 | US$ 126.013.645 | US$ 3.301.778.119 |
| 2018 | US$ 119.193.678 | US$ 3.363.358.444 |
| 2017 | US$ 114.453.074 | US$ 3.223.432.269 |
| 2016 | US$ 106.644.040 | US$ 3.236.363.321 |
| 2015 | US$ 102.521.572 | US$ 3.134.862.102 |
| 2014 | US$ 89.652.489 | US$ 3.440.418.481 |
| 2013 | US$ 81.376.772 | US$ 3.807.448.795 |
| 2012 | US$ 78.759.399 | US$ 3.946.356.885 |
| 2011 | US$ 74.484.612 | US$ 3.847.642.710 |
| 2010 | US$ 73.643.652 | US$ 3.809.844.557 |
| 2009 | US$ 74.351.636 | US$ 3.787.950.101 |
| 2008 | US$ 66.901.218 | US$ 3.729.835.869 |
| 2007 | US$ 54.872.649 | US$ 3.313.815.899 |
| 2006 | US$ 53.825.046 | US$ 3.156.575.442 |
| 2005 | US$ 51.138.108 | US$ 3.143.816.118 |
| 2004 | US$ 46.899.342 | US$ 2.852.268.012 |
| 2003 | US$ 52.325.444 | US$ 2.368.649.861 |
| 2002 | US$ 59.942.138 | US$ 1.974.502.384 |
| 2001 | US$ 66.790.213 | US$ 1.757.254.567 |
| 2000 | US$ 73.143.785 | US$ 1.668.817.718 |
| 1999 | US$ 95.950.450 | US$ 1.818.071.791 |
| 1998 | US$ 87.086.444 | US$ 1.763.779.417 |
| 1997 | US$ 77.275.256 | US$ 1.803.865.596 |
| 1996 | US$ 73.658.490 | US$ 1.964.092.952 |
| 1995 | US$ 7.862.144 | US$ 2.016.529.150 |
| 1994 | US$ 25.909.091 | US$ 1.675.978.156 |
| 1993 | US$ 89.435.807 | US$ 1.697.355.931 |
| 1992 | US$ 87.057.474 | US$ 1.942.300.007 |
| 1991 | US$ 105.313.349 | US$ 1.632.934.517 |
| 1990 | US$ 95.100.657 | US$ 1.448.986.877 |
| 1989 | US$ 42.178.296 | US$ 1.143.715.092 |
| 1988 | US$ 38.190.398 | US$ 1.062.385.978 |
| 1987 | US$ 36.142.038 | US$ 895.866.142 |
| 1986 | US$ 34.917.954 | US$ 742.303.840 |
| 1985 | US$ 27.250.507 | US$ 499.891.677 |
| 1984 | US$ 25.462.465 | US$ 469.387.961 |
| 1983 | US$ 28.042.214 | US$ 520.080.316 |
| 1982 | US$ 28.187.865 | US$ 621.280.577 |
| 1981 | US$ 28.692.140 | US$ 640.400.558 |
| 1980 | US$ 23.550.092 | US$ 666.721.962 |
| 1979 | US$ 19.385.083 | US$ 540.076.076 |
| 1978 | US$ 14.384.134 | US$ 491.803.631 |
| 1977 | US$ 16.069.673 | US$ 443.842.908 |
| 1976 | US$ 10.292.667 | US$ 479.518.714 |
| 1975 | US$ 9.314.443 | US$ 598.829.369 |
| 1974 | US$ 4.539.104 | US$ 760.437.048 |
| 1973 | US$ 5.480.251 | US$ 525.085.622 |
| 1972 | - | US$ 456.425.548 |
| 1971 | - | US$ 398.591.949 |
| 1970 | - | US$ 335.509.119 |
| 1969 | - | US$ 301.633.114 |
| 1968 | - | US$ 299.198.281 |
| 1967 | - | US$ 267.943.783 |
| 1966 | - | US$ 206.904.664 |
| 1965 | - | US$ 186.932.305 |
| 1964 | - | US$ 182.106.546 |
| 1963 | - | US$ 161.564.384 |
| 1962 | - | US$ 162.130.284 |
| 1961 | - | US$ 138.928.393 |
| 1960 | - | US$ 85.337.685 |
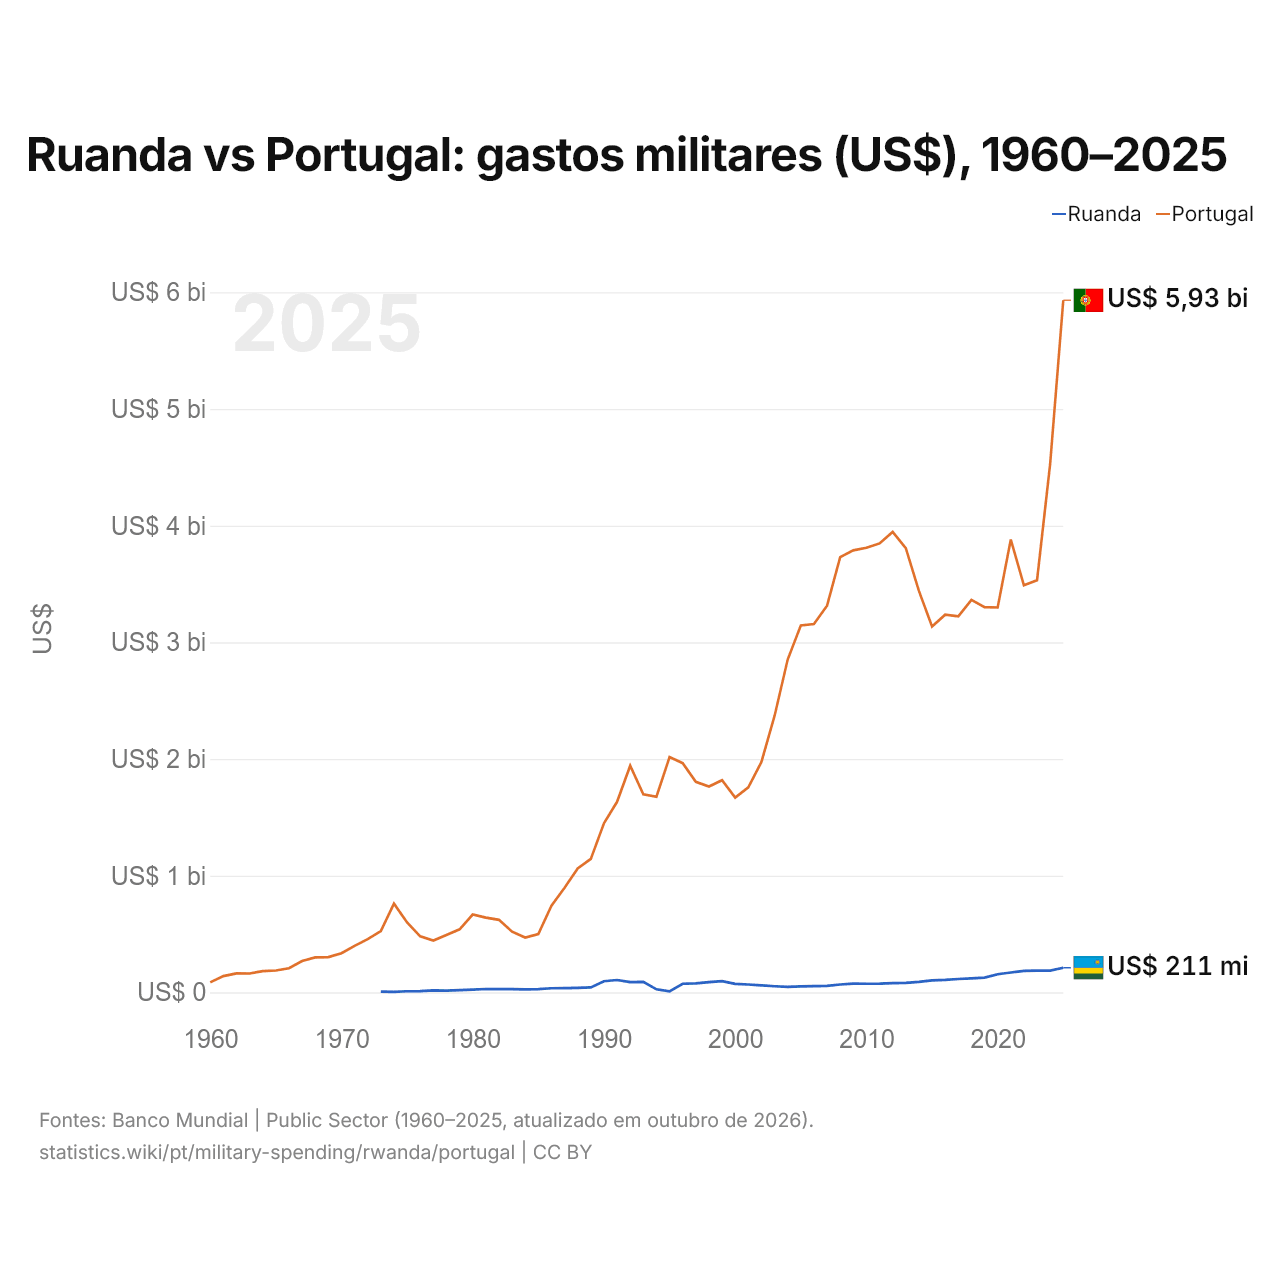
Em 2025, os gastos militares foram de US$ 211 milhões em Ruanda e de US$ 5,93 bilhões em Portugal: 28 vezes mais em Portugal. Em 1973, foram de US$ 5,48 milhões em Ruanda e de US$ 525 milhões em Portugal, 96 vezes mais em Portugal.
Ruanda vs Portugal: gastos militares em % do PIB, 1960–2025
| Ano | % do PIB | |
|---|---|---|
|
Ruanda
|
Portugal
|
|
| 2025 | 1,3% | 1,7% |
| 2024 | 1,2% | 1,4% |
| 2023 | 1,3% | 1,2% |
| 2022 | 1,3% | 1,4% |
| 2021 | 1,5% | 1,5% |
| 2020 | 1,5% | 1,4% |
| 2019 | 1,2% | 1,4% |
| 2018 | 1,2% | 1,4% |
| 2017 | 1,2% | 1,5% |
| 2016 | 1,2% | 1,6% |
| 2015 | 1,2% | 1,6% |
| 2014 | 1,1% | 1,5% |
| 2013 | 1,1% | 1,7% |
| 2012 | 1% | 1,8% |
| 2011 | 1,1% | 1,6% |
| 2010 | 1,2% | 1,6% |
| 2009 | 1,3% | 1,5% |
| 2008 | 1,3% | 1,4% |
| 2007 | 1,4% | 1,4% |
| 2006 | 1,6% | 1,5% |
| 2005 | 1,7% | 1,6% |
| 2004 | 2% | 1,5% |
| 2003 | 2,4% | 1,4% |
| 2002 | 3% | 1,5% |
| 2001 | 3,4% | 1,4% |
| 2000 | 3,5% | 1,4% |
| 1999 | 4,4% | 1,4% |
| 1998 | 4,4% | 1,4% |
| 1997 | 4,2% | 1,5% |
| 1996 | 5,3% | 1,6% |
| 1995 | 0,6% | 1,7% |
| 1994 | 3,4% | 1,7% |
| 1993 | 4,5% | 1,8% |
| 1992 | 4,3% | 1,8% |
| 1991 | 5,5% | 1,8% |
| 1990 | 3,7% | 1,8% |
| 1989 | 1,8% | 1,9% |
| 1988 | 1,6% | 1,9% |
| 1987 | 1,7% | 1,9% |
| 1986 | 1,8% | 1,9% |
| 1985 | 1,6% | 1,8% |
| 1984 | 1,6% | 1,9% |
| 1983 | 1,9% | 1,9% |
| 1982 | 2% | 2% |
| 1981 | 2% | 2% |
| 1980 | 1,9% | 2% |
| 1979 | 1,7% | 2% |
| 1978 | 1,6% | 2,1% |
| 1977 | 2,2% | 2,1% |
| 1976 | 1,6% | 2,4% |
| 1975 | 1,6% | 3,1% |
| 1974 | 1,5% | 4,3% |
| 1973 | 1,9% | 3,5% |
| 1972 | - | 4,1% |
| 1971 | - | 4,3% |
| 1970 | - | 4,1% |
| 1969 | - | 4,1% |
| 1968 | - | 4,5% |
| 1967 | - | 4,5% |
| 1966 | - | 3,9% |
| 1965 | - | 3,8% |
| 1964 | - | 4,1% |
| 1963 | - | 4% |
| 1962 | - | 4,2% |
| 1961 | - | 3,9% |
| 1960 | - | 2,6% |
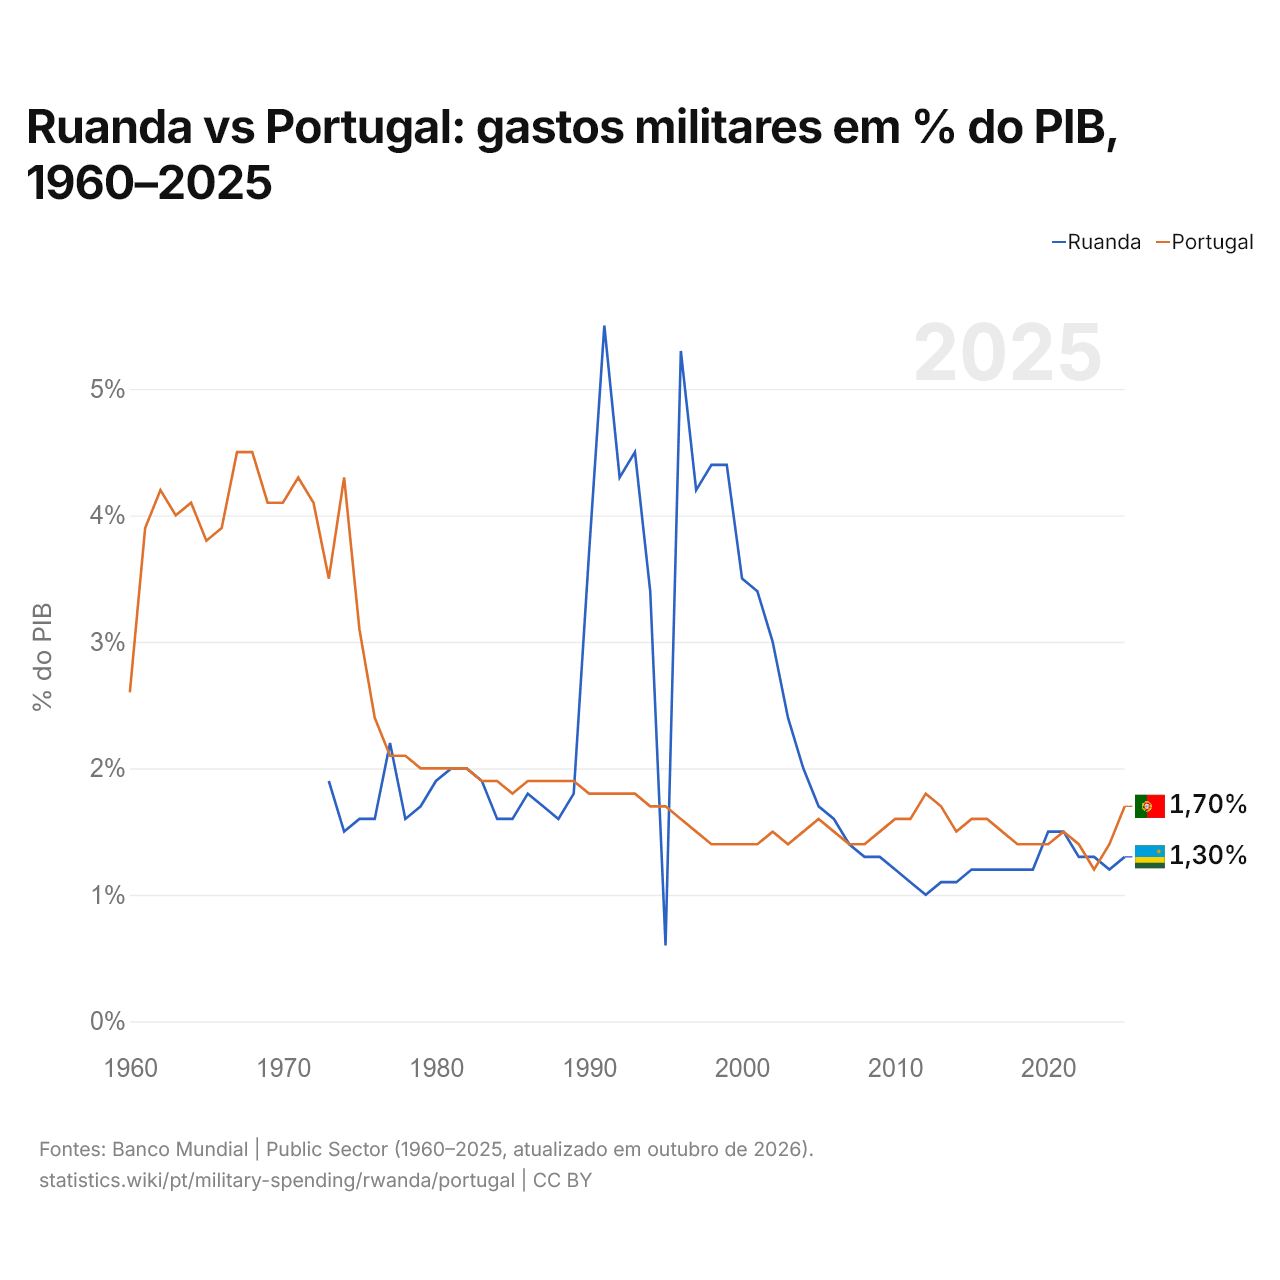
Em 2025, os gastos militares foram de 1,3% do PIB em Ruanda e de 1,7% em Portugal: 0,4 pontos percentuais a mais em Portugal. Em 2015, foram de 1,2% em Ruanda e de 1,6% em Portugal, 0,4 pontos percentuais a mais em Portugal.
A diferença foi máxima em 1996, quando os gastos militares de Ruanda superaram os de Portugal em 3,7 pontos percentuais do PIB.
Ruanda vs Portugal: dados dos gastos militares
|
Ruanda
|
Portugal
|
|
|---|---|---|
| US$, 2025 | US$ 211 mi | US$ 5,93 bi |
| % do PIB, 2025 | 1,3% | 1,7% |
| Por pessoa, US$ | US$ 14,5 | US$ 549 |
| Participação mundial | 0,007% | 0,21% |
| Posição mundial | 128/154 | 46/154 |
Comparar os gastos militares de 2 países quaisquer
Fontes:
- Banco Mundial | Public Sector (1960–2025, atualizado em outubro de 2026)
Creative Commons Atribuição (CC BY): você pode copiar, compartilhar, adaptar e reutilizar este conteúdo, inclusive para fins comerciais, desde que cite o statistics.wiki e indique as alterações que fizer. As fontes listadas acima podem ter suas próprias condições de licença.