
Noruega vs Israel: gastos militares (US$), 1960–2025
| Ano | US$ | |
|---|---|---|
 Noruega |
 Israel |
|
| 2025 | US$ 17.400.727.738 | US$ 47.696.033.185 |
| 2024 | US$ 11.178.024.169 | US$ 45.921.377.944 |
| 2023 | US$ 9.150.099.453 | US$ 27.102.879.898 |
| 2022 | US$ 9.000.901.775 | US$ 22.772.546.913 |
| 2021 | US$ 8.743.564.004 | US$ 23.566.015.120 |
| 2020 | US$ 7.515.022.166 | US$ 21.035.147.446 |
| 2019 | US$ 7.821.953.060 | US$ 19.793.980.550 |
| 2018 | US$ 7.797.550.984 | US$ 19.262.910.164 |
| 2017 | US$ 7.087.864.914 | US$ 18.828.969.647 |
| 2016 | US$ 6.199.020.919 | US$ 16.602.757.691 |
| 2015 | US$ 6.002.518.147 | US$ 15.975.634.696 |
| 2014 | US$ 7.542.869.668 | US$ 17.153.822.653 |
| 2013 | US$ 7.590.220.300 | US$ 15.737.032.127 |
| 2012 | US$ 7.315.402.983 | US$ 13.982.341.034 |
| 2011 | US$ 7.398.270.592 | US$ 14.547.222.878 |
| 2010 | US$ 6.635.555.157 | US$ 13.671.551.479 |
| 2009 | US$ 6.318.404.981 | US$ 12.608.502.172 |
| 2008 | US$ 6.468.801.230 | US$ 13.643.456.573 |
| 2007 | US$ 5.950.704.723 | US$ 11.229.545.538 |
| 2006 | US$ 5.053.062.799 | US$ 9.227.846.795 |
| 2005 | US$ 4.907.577.610 | US$ 8.812.760.099 |
| 2004 | US$ 4.894.667.089 | US$ 8.568.320.539 |
| 2003 | US$ 4.513.730.916 | US$ 8.134.330.828 |
| 2002 | US$ 4.054.342.965 | US$ 7.918.119.424 |
| 2001 | US$ 2.954.920.637 | US$ 8.381.500.855 |
| 2000 | US$ 2.908.092.909 | US$ 8.207.488.167 |
| 1999 | US$ 3.287.195.096 | US$ 7.542.229.863 |
| 1998 | US$ 3.297.466.855 | US$ 7.978.828.529 |
| 1997 | US$ 3.225.955.711 | US$ 8.456.766.318 |
| 1996 | US$ 3.513.375.674 | US$ 8.376.722.068 |
| 1995 | US$ 3.486.190.503 | US$ 7.831.373.985 |
| 1994 | US$ 3.381.680.163 | US$ 9.177.200.760 |
| 1993 | US$ 3.156.173.309 | US$ 9.196.309.022 |
| 1992 | US$ 3.779.288.930 | US$ 8.675.456.841 |
| 1991 | US$ 3.268.065.034 | US$ 11.059.734.636 |
| 1990 | US$ 3.382.209.992 | US$ 7.662.202.393 |
| 1989 | US$ 2.920.947.314 | US$ 6.522.947.452 |
| 1988 | US$ 2.883.298.847 | US$ 8.391.115.254 |
| 1987 | US$ 2.797.043.377 | US$ 7.270.945.603 |
| 1986 | US$ 2.202.871.919 | US$ 5.288.619.484 |
| 1985 | US$ 1.823.312.690 | US$ 4.795.577.076 |
| 1984 | US$ 1.574.141.754 | US$ 4.956.082.038 |
| 1983 | US$ 1.716.606.823 | US$ 5.076.928.419 |
| 1982 | US$ 1.714.090.051 | US$ 5.376.203.636 |
| 1981 | US$ 1.663.409.530 | US$ 5.443.543.755 |
| 1980 | US$ 1.680.802.233 | US$ 4.801.649.134 |
| 1979 | US$ 1.464.492.202 | US$ 4.380.124.292 |
| 1978 | US$ 1.317.121.484 | US$ 4.049.524.974 |
| 1977 | US$ 1.281.487.637 | US$ 4.212.457.725 |
| 1976 | US$ 1.118.885.308 | US$ 4.663.649.348 |
| 1975 | US$ 1.050.521.677 | US$ 4.914.361.654 |
| 1974 | US$ 820.608.817 | US$ 4.746.203.004 |
| 1973 | US$ 702.982.336 | US$ 3.313.546.062 |
| 1972 | US$ 568.894.736 | US$ 1.877.569.571 |
| 1971 | US$ 492.558.588 | US$ 1.606.973.896 |
| 1970 | US$ 442.908.705 | US$ 1.735.584.449 |
| 1969 | US$ 399.477.527 | US$ 1.201.475.189 |
| 1968 | US$ 367.231.746 | US$ 950.708.578 |
| 1967 | US$ 334.820.158 | US$ 734.978.433 |
| 1966 | US$ 310.859.503 | US$ 443.467.169 |
| 1965 | US$ 274.334.803 | US$ 370.736.979 |
| 1964 | US$ 223.719.863 | US$ 361.349.246 |
| 1963 | US$ 209.262.230 | US$ 344.668.589 |
| 1962 | US$ 197.025.496 | US$ 271.555.520 |
| 1961 | US$ 169.523.276 | US$ 291.500.933 |
| 1960 | US$ 165.552.499 | US$ 228.931.965 |
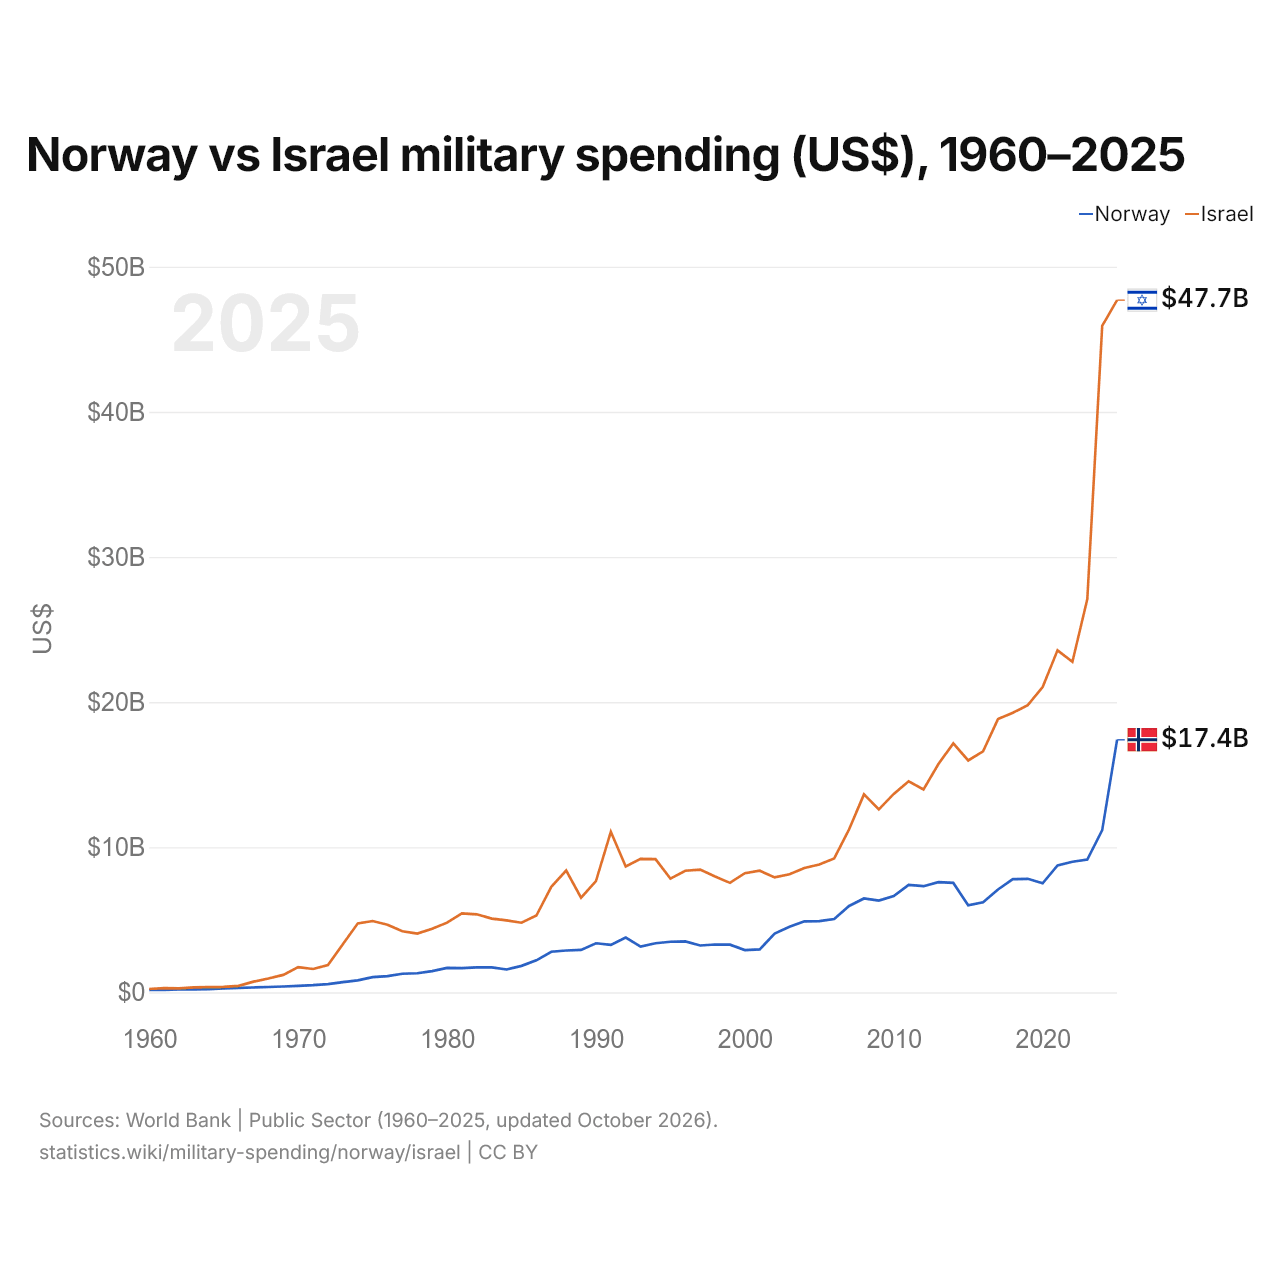
Em 2025, os gastos militares foram de US$ 17,4 bilhões na Noruega e de US$ 47,7 bilhões em Israel: 2,7 vezes mais em Israel. Em 1960, foram de US$ 166 milhões na Noruega e de US$ 229 milhões em Israel, 38% a mais em Israel.
Noruega vs Israel: gastos militares em % do PIB, 1960–2025
| Ano | % do PIB | |
|---|---|---|
|
Noruega
|
Israel
|
|
| 2025 | 3,3% | 7,8% |
| 2024 | 2,2% | 8,5% |
| 2023 | 1,8% | 5,3% |
| 2022 | 1,5% | 4,3% |
| 2021 | 1,7% | 4,8% |
| 2020 | 2% | 5,1% |
| 2019 | 1,8% | 5% |
| 2018 | 1,7% | 5,1% |
| 2017 | 1,7% | 5,3% |
| 2016 | 1,6% | 5,2% |
| 2015 | 1,5% | 5,3% |
| 2014 | 1,5% | 5,5% |
| 2013 | 1,4% | 5,3% |
| 2012 | 1,4% | 5,3% |
| 2011 | 1,4% | 5,4% |
| 2010 | 1,5% | 5,7% |
| 2009 | 1,6% | 5,9% |
| 2008 | 1,4% | 6,2% |
| 2007 | 1,5% | 6,1% |
| 2006 | 1,4% | 5,8% |
| 2005 | 1,6% | 6% |
| 2004 | 1,8% | 6,1% |
| 2003 | 2% | 6,2% |
| 2002 | 2,1% | 6,3% |
| 2001 | 1,7% | 6,2% |
| 2000 | 1,7% | 6% |
| 1999 | 2% | 6,2% |
| 1998 | 2,2% | 6,6% |
| 1997 | 2% | 7,1% |
| 1996 | 2,2% | 7,3% |
| 1995 | 2,3% | 7,4% |
| 1994 | 2,7% | 10,1% |
| 1993 | 2,6% | 11,5% |
| 1992 | 2,9% | 10,9% |
| 1991 | 2,7% | 15,6% |
| 1990 | 2,8% | 12,4% |
| 1989 | 2,9% | 12,4% |
| 1988 | 2,8% | 15,9% |
| 1987 | 3% | 16,9% |
| 1986 | 2,8% | 14,8% |
| 1985 | 2,8% | 16,6% |
| 1984 | 2,5% | 16,2% |
| 1983 | 2,8% | 15,5% |
| 1982 | 2,7% | 18,4% |
| 1981 | 2,6% | 20,3% |
| 1980 | 2,6% | 18,9% |
| 1979 | 2,8% | 19,4% |
| 1978 | 2,8% | 22,9% |
| 1977 | 3,1% | 23,1% |
| 1976 | 3,1% | 29,2% |
| 1975 | 3,2% | 30,5% |
| 1974 | 3% | 27,7% |
| 1973 | 3,1% | 27,9% |
| 1972 | 3,3% | 20,4% |
| 1971 | 3,4% | 22,8% |
| 1970 | 3,5% | 23,4% |
| 1969 | 3,6% | 19,1% |
| 1968 | 3,6% | 17,4% |
| 1967 | 3,5% | 15,4% |
| 1966 | 3,6% | 9,4% |
| 1965 | 3,4% | 8,6% |
| 1964 | 3,1% | 9% |
| 1963 | 3,2% | 9,8% |
| 1962 | 3,2% | 9,2% |
| 1961 | 3% | 7,9% |
| 1960 | 3,2% | 7,5% |
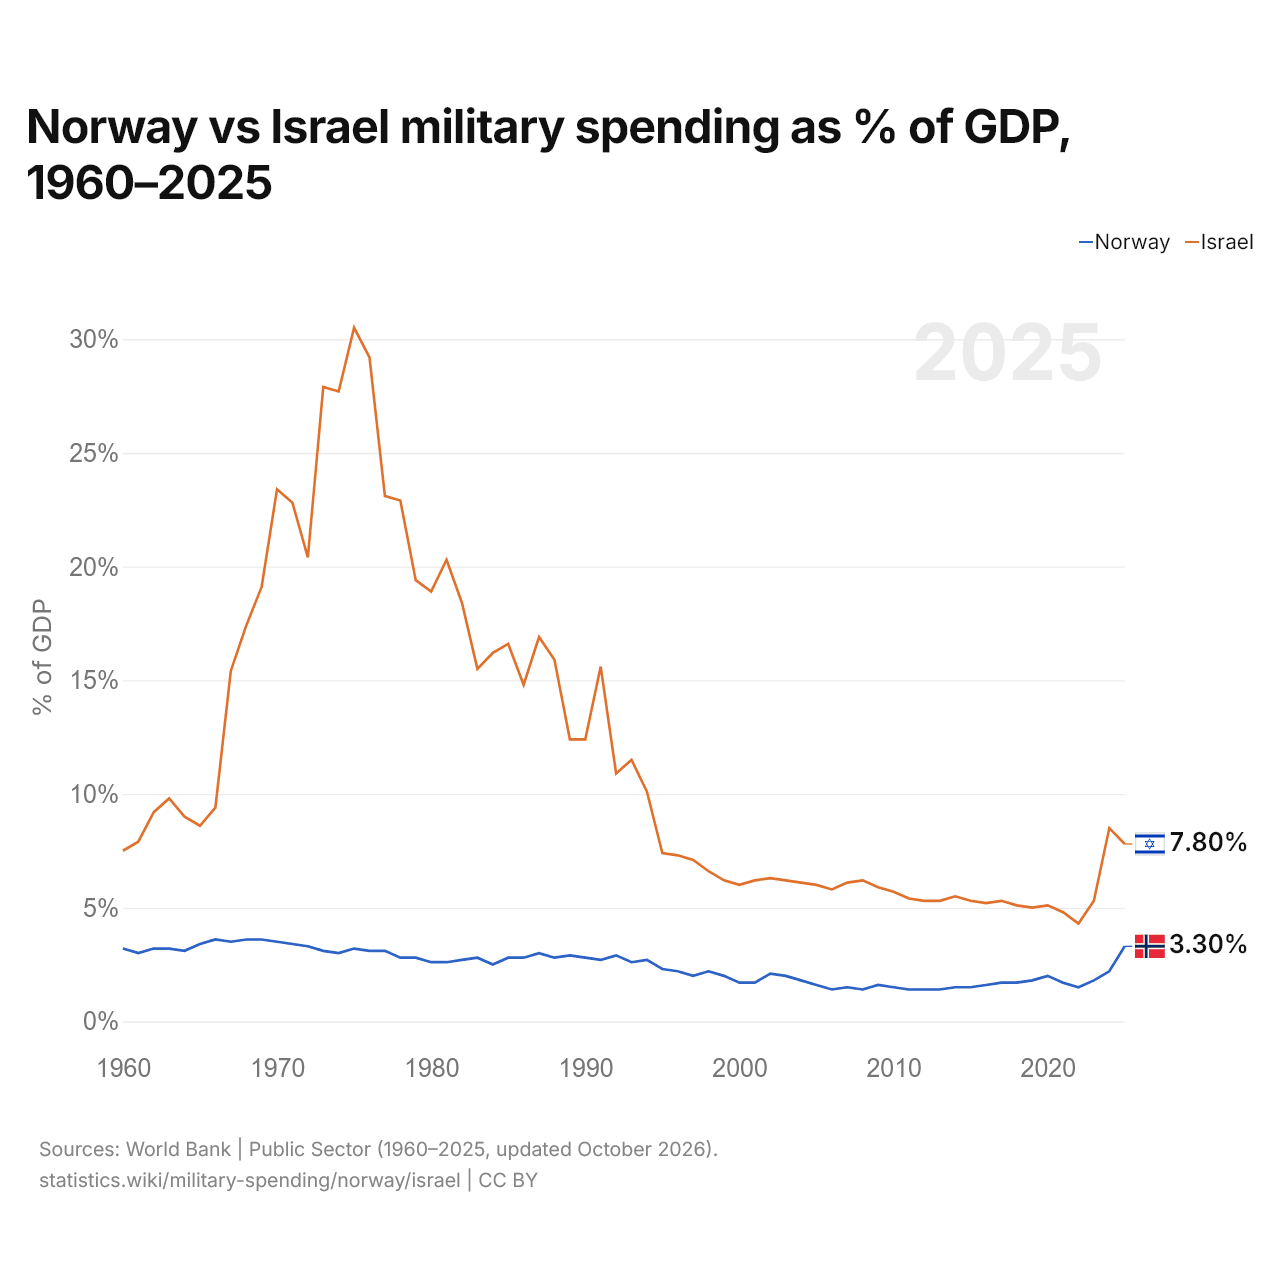
Em 2025, os gastos militares foram de 3,3% do PIB na Noruega e de 7,8% em Israel: 4,5 pontos percentuais a mais em Israel. Em 2015, foram de 1,5% na Noruega e de 5,3% em Israel, 3,8 pontos percentuais a mais em Israel.
Os gastos militares de Israel, como proporção do PIB, têm sido mais altos que os da Noruega todos os anos desde 1960. A diferença foi máxima em 1975, quando os gastos militares de Israel superaram os da Noruega em 27,3 pontos percentuais do PIB.
Noruega vs Israel: dados dos gastos militares
|
Noruega
|
Israel
|
|
|---|---|---|
| US$, 2025 | US$ 17,4 bi | US$ 47,7 bi |
| % do PIB, 2025 | 3,3% | 7,8% |
| Por pessoa, US$ | US$ 3.101 | US$ 4.712 |
| Participação mundial | 0,61% | 1,67% |
| Posição mundial | 23/154 | 13/154 |
Comparar os gastos militares de 2 países quaisquer
Fontes:
- Banco Mundial | Public Sector (1960–2025, atualizado em outubro de 2026)
Creative Commons Atribuição (CC BY): você pode copiar, compartilhar, adaptar e reutilizar este conteúdo, inclusive para fins comerciais, desde que cite o statistics.wiki e indique as alterações que fizer. As fontes listadas acima podem ter suas próprias condições de licença.