
Nepal vs Japão: gastos militares (US$), 1960–2025
| Ano | US$ | |
|---|---|---|
 Nepal |
 Japão |
|
| 2025 | US$ 439.315.331 | US$ 62.609.864.919 |
| 2024 | US$ 443.760.716 | US$ 54.245.069.556 |
| 2023 | US$ 461.493.437 | US$ 48.096.470.836 |
| 2022 | US$ 472.561.793 | US$ 43.144.132.918 |
| 2021 | US$ 448.938.111 | US$ 53.616.495.860 |
| 2020 | US$ 442.455.853 | US$ 51.388.082.015 |
| 2019 | US$ 422.476.702 | US$ 50.782.354.519 |
| 2018 | US$ 446.999.694 | US$ 48.518.354.328 |
| 2017 | US$ 430.221.486 | US$ 45.029.861.071 |
| 2016 | US$ 360.351.039 | US$ 46.510.024.990 |
| 2015 | US$ 333.287.680 | US$ 42.106.110.979 |
| 2014 | US$ 325.916.728 | US$ 46.903.457.732 |
| 2013 | US$ 297.134.416 | US$ 49.023.953.366 |
| 2012 | US$ 269.921.937 | US$ 60.011.575.603 |
| 2011 | US$ 291.392.439 | US$ 60.762.198.739 |
| 2010 | US$ 218.886.910 | US$ 54.655.477.013 |
| 2009 | US$ 185.028.874 | US$ 51.465.158.207 |
| 2008 | US$ 175.582.704 | US$ 46.361.235.314 |
| 2007 | US$ 139.765.675 | US$ 40.530.225.228 |
| 2006 | US$ 138.371.793 | US$ 41.552.485.700 |
| 2005 | US$ 137.200.726 | US$ 44.300.524.700 |
| 2004 | US$ 114.104.906 | US$ 45.339.809.417 |
| 2003 | US$ 88.172.128 | US$ 42.485.994.124 |
| 2002 | US$ 76.624.103 | US$ 39.333.708.170 |
| 2001 | US$ 57.713.815 | US$ 40.758.000.772 |
| 2000 | US$ 43.074.378 | US$ 45.509.462.675 |
| 1999 | US$ 38.857.001 | US$ 43.122.982.293 |
| 1998 | US$ 36.683.832 | US$ 37.848.918.937 |
| 1997 | US$ 35.297.909 | US$ 40.634.866.858 |
| 1996 | US$ 33.185.302 | US$ 44.047.064.188 |
| 1995 | US$ 33.763.124 | US$ 49.961.673.238 |
| 1994 | US$ 32.244.023 | US$ 45.285.691.376 |
| 1993 | US$ 30.564.647 | US$ 44.039.316.448 |
| 1992 | US$ 29.154.250 | US$ 38.544.439.528 |
| 1991 | US$ 34.069.585 | US$ 35.044.558.915 |
| 1990 | US$ 31.839.049 | US$ 30.636.431.903 |
| 1989 | US$ 31.785.041 | US$ 29.869.183.898 |
| 1988 | US$ 30.793.995 | US$ 30.310.401.999 |
| 1987 | US$ 34.279.972 | US$ 25.442.124.704 |
| 1986 | US$ 33.720.495 | US$ 20.842.255.076 |
| 1985 | US$ 31.329.643 | US$ 13.979.102.078 |
| 1984 | US$ 31.506.588 | US$ 13.170.056.544 |
| 1983 | US$ 30.661.264 | US$ 12.357.220.999 |
| 1982 | US$ 26.097.039 | US$ 10.960.248.415 |
| 1981 | US$ 22.575.000 | US$ 11.654.664.249 |
| 1980 | US$ 20.083.332 | US$ 10.456.787.749 |
| 1979 | US$ 16.868.696 | US$ 9.986.839.054 |
| 1978 | US$ 13.771.162 | US$ 9.424.638.219 |
| 1977 | US$ 12.332.986 | US$ 6.703.182.674 |
| 1976 | US$ 12.439.668 | US$ 5.452.405.066 |
| 1975 | US$ 10.749.606 | US$ 4.936.934.814 |
| 1974 | US$ 7.395.858 | US$ 4.313.402.711 |
| 1973 | US$ 6.393.328 | US$ 3.673.734.622 |
| 1972 | US$ 6.631.614 | US$ 2.795.134.058 |
| 1971 | US$ 5.454.701 | US$ 2.064.674.316 |
| 1970 | US$ 5.135.401 | US$ 1.715.009.394 |
| 1969 | - | US$ 1.453.785.367 |
| 1968 | - | US$ 1.271.785.959 |
| 1967 | - | US$ 1.131.129.601 |
| 1966 | - | US$ 1.015.092.385 |
| 1965 | - | US$ 894.206.643 |
| 1964 | - | US$ 781.704.862 |
| 1963 | - | US$ 685.721.485 |
| 1962 | - | US$ 585.914.688 |
| 1961 | - | US$ 535.995.933 |
| 1960 | - | US$ 523.200.321 |
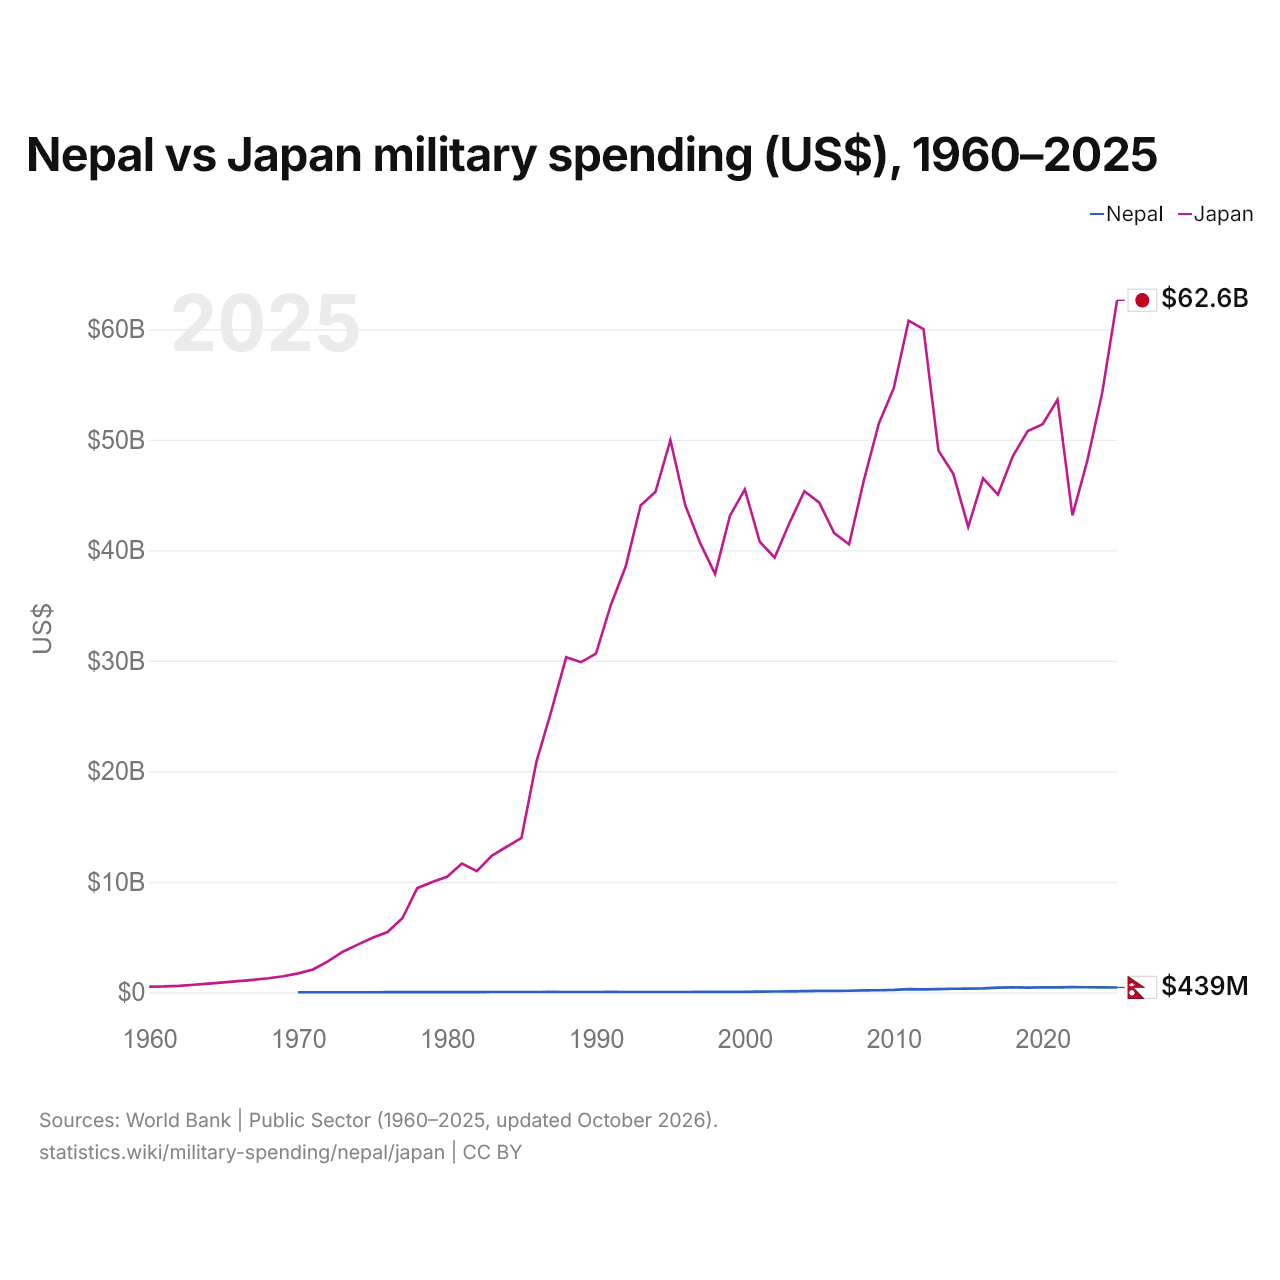
Em 2025, os gastos militares foram de US$ 439 milhões no Nepal e de US$ 62,6 bilhões no Japão: 140 vezes mais no Japão. Em 1970, foram de US$ 5,14 milhões no Nepal e de US$ 1,72 bilhão no Japão, 330 vezes mais no Japão.
Nepal vs Japão: gastos militares em % do PIB, 1960–2025
| Ano | % do PIB | |
|---|---|---|
|
Nepal
|
Japão
|
|
| 2025 | 1% | 1,4% |
| 2024 | 1% | 1,3% |
| 2023 | 1,1% | 1,1% |
| 2022 | 1,1% | 1% |
| 2021 | 1,2% | 1% |
| 2020 | 1,3% | 1% |
| 2019 | 1,2% | 1% |
| 2018 | 1,3% | 0,9% |
| 2017 | 1,5% | 0,9% |
| 2016 | 1,5% | 0,9% |
| 2015 | 1,4% | 0,9% |
| 2014 | 1,4% | 0,9% |
| 2013 | 1,3% | 0,9% |
| 2012 | 1,2% | 0,9% |
| 2011 | 1,4% | 1% |
| 2010 | 1,4% | 0,9% |
| 2009 | 1,4% | 1% |
| 2008 | 1,4% | 0,9% |
| 2007 | 1,4% | 0,9% |
| 2006 | 1,5% | 0,9% |
| 2005 | 1,7% | 0,9% |
| 2004 | 1,6% | 0,9% |
| 2003 | 1,4% | 0,9% |
| 2002 | 1,3% | 0,9% |
| 2001 | 1% | 0,9% |
| 2000 | 0,8% | 0,9% |
| 1999 | 0,8% | 0,9% |
| 1998 | 0,8% | 0,9% |
| 1997 | 0,7% | 0,9% |
| 1996 | 0,7% | 0,9% |
| 1995 | 0,8% | 0,9% |
| 1994 | 0,8% | 0,9% |
| 1993 | 0,8% | 1% |
| 1992 | 0,9% | 0,9% |
| 1991 | 0,9% | 0,9% |
| 1990 | 0,9% | 0,9% |
| 1989 | 0,9% | 0,9% |
| 1988 | 0,9% | 0,9% |
| 1987 | 1,2% | 1% |
| 1986 | 1,2% | 1% |
| 1985 | 1,2% | 1% |
| 1984 | 1,2% | 1% |
| 1983 | 1,3% | 1% |
| 1982 | 1,1% | 0,9% |
| 1981 | 1% | 0,9% |
| 1980 | 1% | 0,9% |
| 1979 | 0,9% | 0,9% |
| 1978 | 0,9% | 0,9% |
| 1977 | 0,9% | 0,9% |
| 1976 | 0,9% | 0,9% |
| 1975 | 0,7% | 0,9% |
| 1974 | 0,6% | 0,9% |
| 1973 | 0,7% | 0,8% |
| 1972 | 0,6% | 0,8% |
| 1971 | 0,6% | 0,8% |
| 1970 | 0,6% | 0,8% |
| 1969 | - | 0,8% |
| 1968 | - | 0,8% |
| 1967 | - | 0,8% |
| 1966 | - | 0,9% |
| 1965 | - | 0,9% |
| 1964 | - | 0,9% |
| 1963 | - | 0,9% |
| 1962 | - | 0,9% |
| 1961 | - | 0,9% |
| 1960 | - | 1,1% |
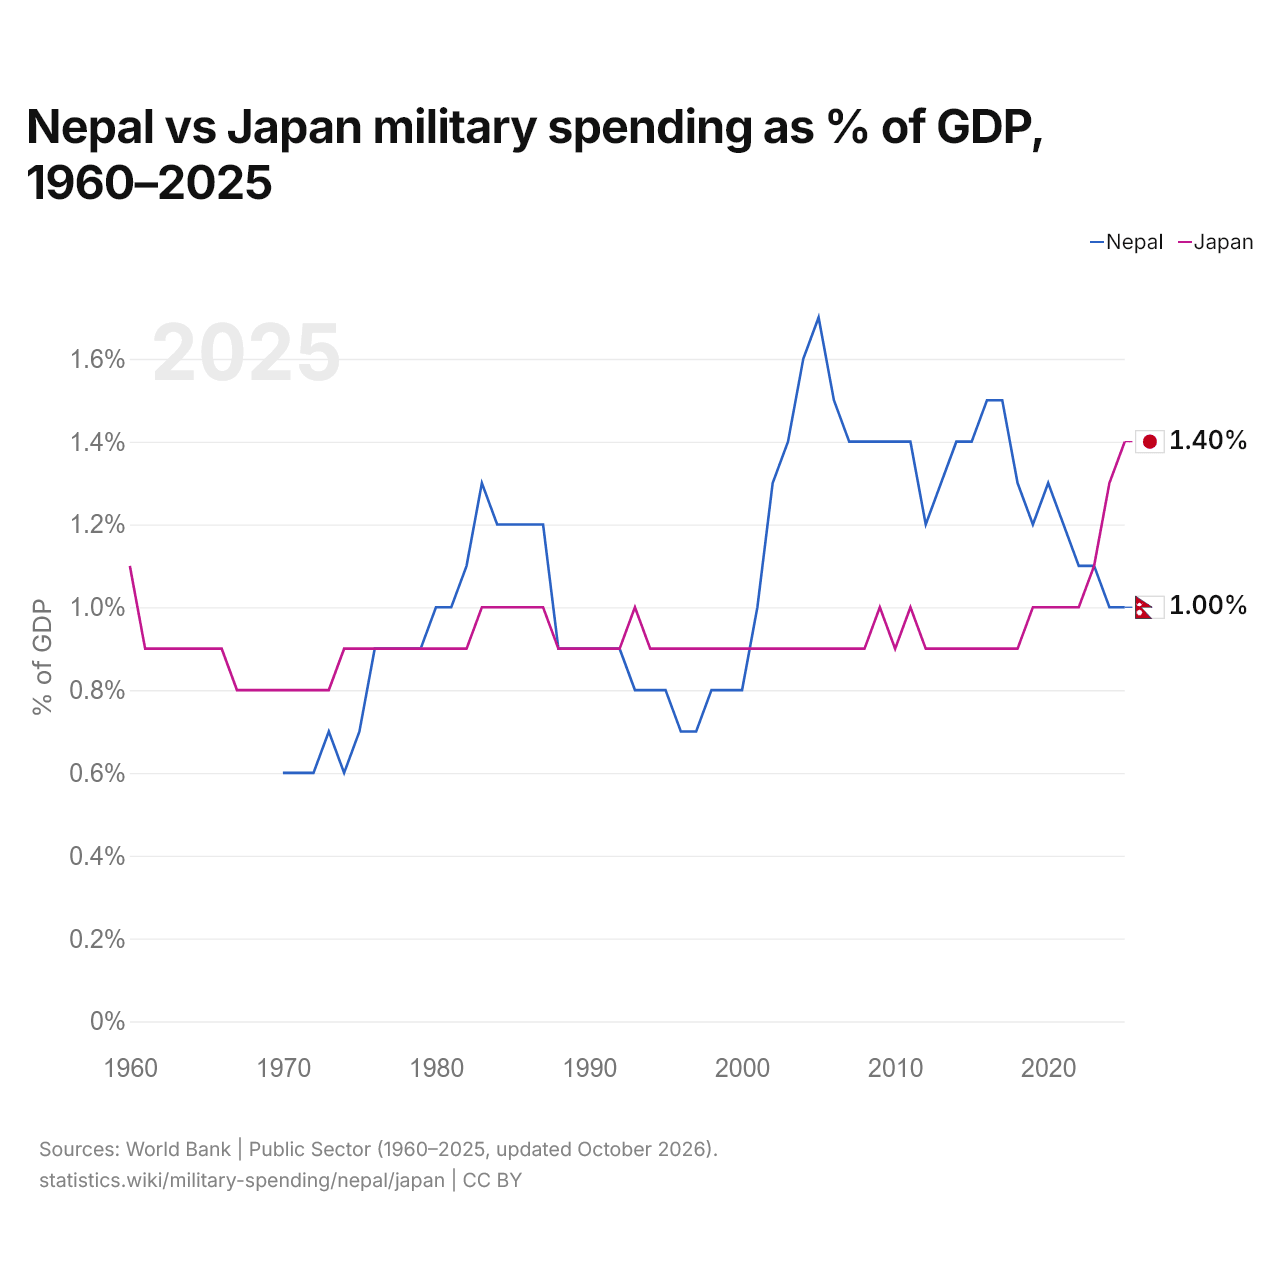
Em 2025, os gastos militares foram de 1,0% do PIB no Nepal e de 1,4% no Japão: 0,4 pontos percentuais a mais no Japão. Em 2015, foram de 1,4% no Nepal e de 0,9% no Japão, 0,5 pontos percentuais a mais no Nepal.
A diferença foi máxima em 2005, quando os gastos militares do Nepal superaram os do Japão em 0,8 ponto percentual do PIB.
Nepal vs Japão: dados dos gastos militares
|
Nepal
|
Japão
|
|
|---|---|---|
| US$, 2025 | US$ 439 mi | US$ 62,6 bi |
| % do PIB, 2025 | 1,0% | 1,4% |
| Por pessoa, US$ | US$ 14,8 | US$ 508 |
| Participação mundial | 0,02% | 2,19% |
| Posição mundial | 108/154 | 10/154 |
Comparar os gastos militares de 2 países quaisquer
Fontes:
- Banco Mundial | Public Sector (1960–2025, atualizado em outubro de 2026)
Creative Commons Atribuição (CC BY): você pode copiar, compartilhar, adaptar e reutilizar este conteúdo, inclusive para fins comerciais, desde que cite o statistics.wiki e indique as alterações que fizer. As fontes listadas acima podem ter suas próprias condições de licença.