
Singapura vs Japão: gráficos dos gastos com saúde por pessoa, US$ e $ PPC
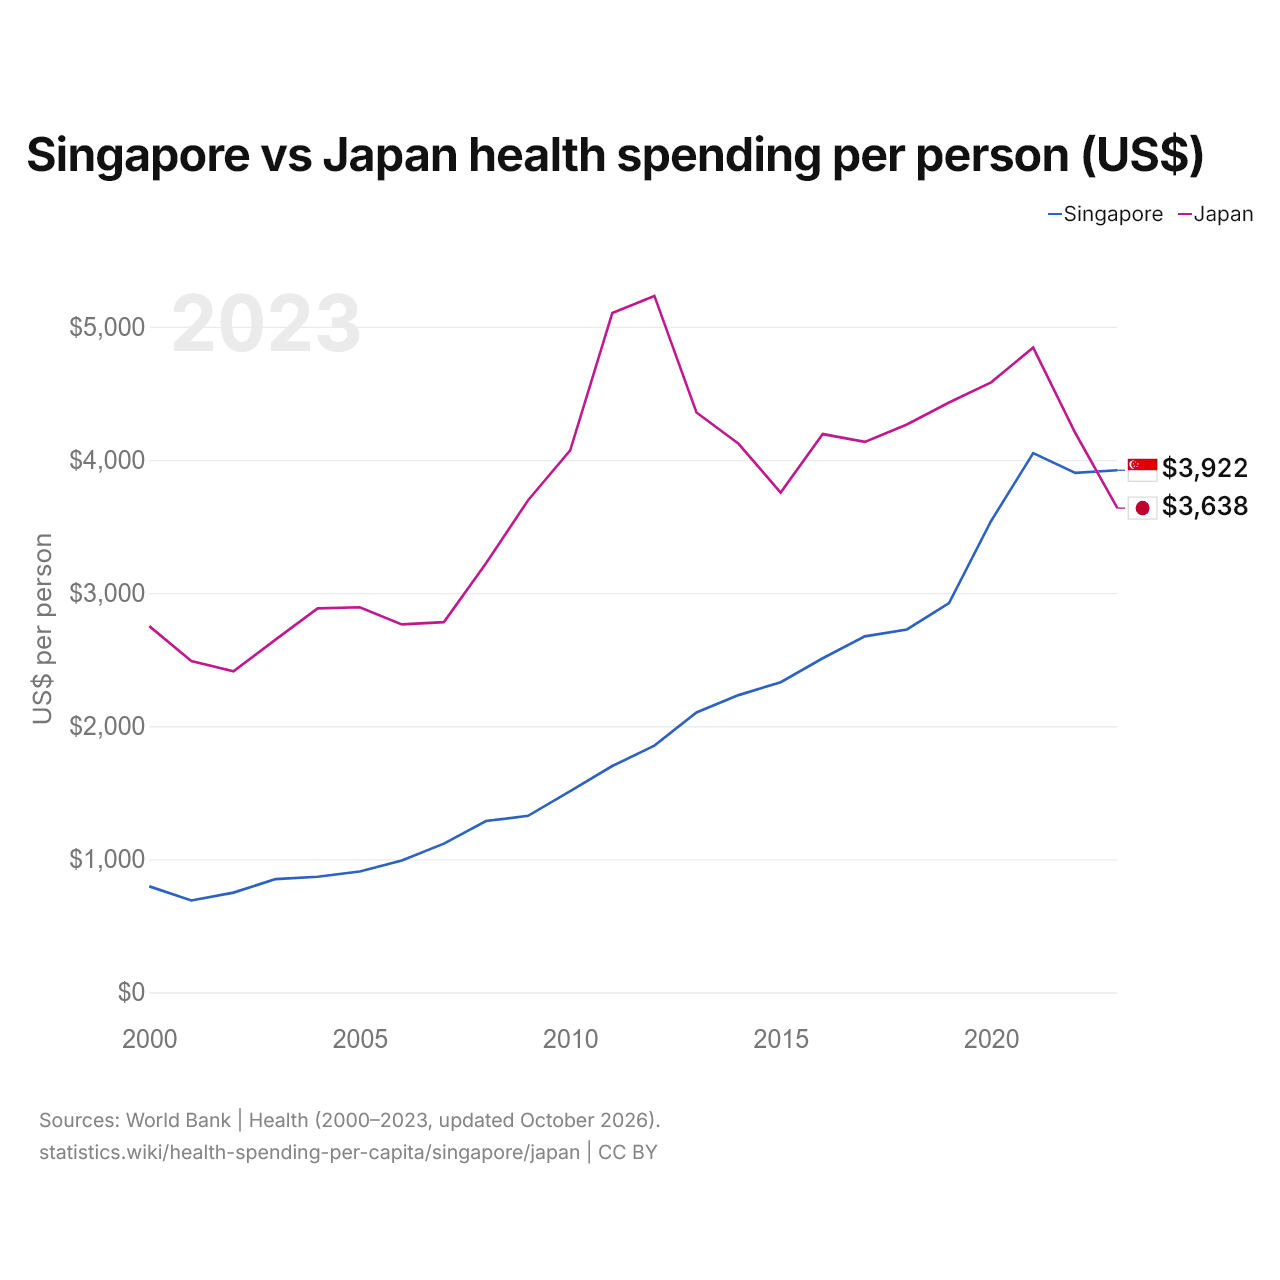
1x
| Ano | US$ por pessoa | |
|---|---|---|
 Singapura |
 Japão |
|
| 2023 | US$ 3.922 | US$ 3.638 |
| 2022 | US$ 3.902 | US$ 4.202 |
| 2021 | US$ 4.051 | US$ 4.844 |
| 2020 | US$ 3.541 | US$ 4.582 |
| 2019 | US$ 2.924 | US$ 4.431 |
| 2018 | US$ 2.726 | US$ 4.266 |
| 2017 | US$ 2.674 | US$ 4.135 |
| 2016 | US$ 2.510 | US$ 4.194 |
| 2015 | US$ 2.330 | US$ 3.754 |
| 2014 | US$ 2.233 | US$ 4.121 |
| 2013 | US$ 2.103 | US$ 4.356 |
| 2012 | US$ 1.853 | US$ 5.232 |
| 2011 | US$ 1.700 | US$ 5.103 |
| 2010 | US$ 1.511 | US$ 4.072 |
| 2009 | US$ 1.326 | US$ 3.697 |
| 2008 | US$ 1.287 | US$ 3.223 |
| 2007 | US$ 1.117 | US$ 2.781 |
| 2006 | US$ 990 | US$ 2.764 |
| 2005 | US$ 908 | US$ 2.893 |
| 2004 | US$ 868 | US$ 2.885 |
| 2003 | US$ 851 | US$ 2.650 |
| 2002 | US$ 749 | US$ 2.412 |
| 2001 | US$ 690 | US$ 2.489 |
| 2000 | US$ 796 | US$ 2.751 |
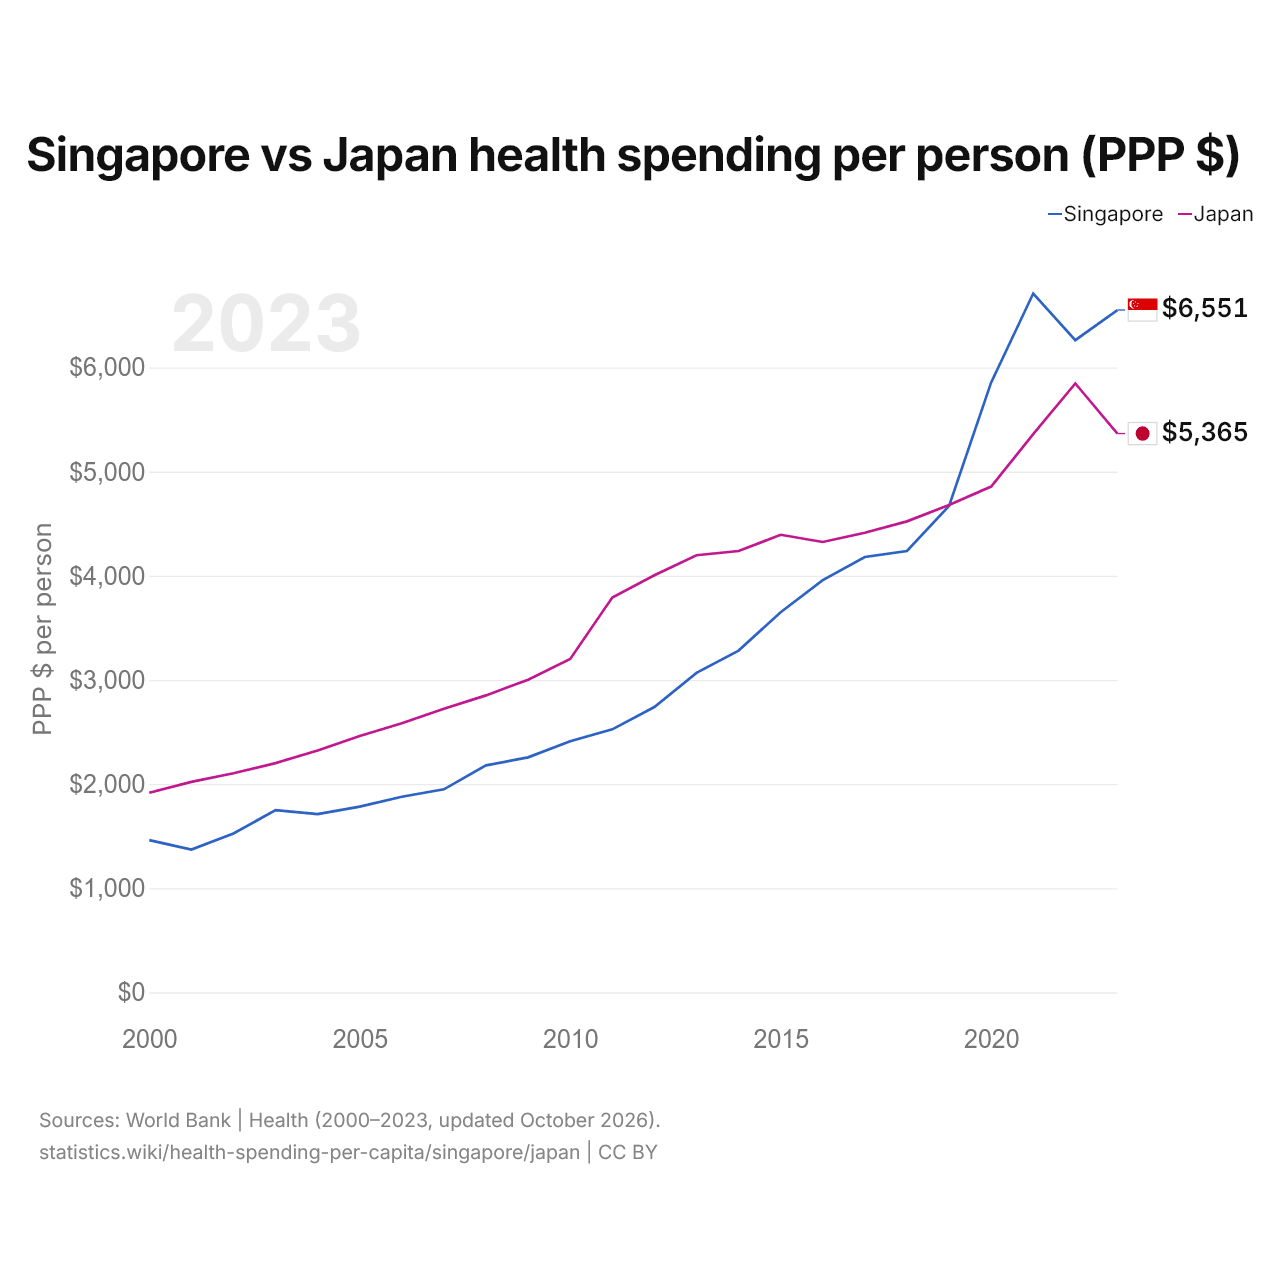
1x
| Ano | $ PPC por pessoa | |
|---|---|---|
|
Singapura
|
Japão
|
|
| 2023 | $ 6.551 | $ 5.365 |
| 2022 | $ 6.262 | $ 5.846 |
| 2021 | $ 6.710 | $ 5.359 |
| 2020 | $ 5.854 | $ 4.856 |
| 2019 | $ 4.670 | $ 4.679 |
| 2018 | $ 4.237 | $ 4.522 |
| 2017 | $ 4.180 | $ 4.413 |
| 2016 | $ 3.958 | $ 4.324 |
| 2015 | $ 3.650 | $ 4.393 |
| 2014 | $ 3.281 | $ 4.237 |
| 2013 | $ 3.067 | $ 4.197 |
| 2012 | $ 2.739 | $ 4.004 |
| 2011 | $ 2.525 | $ 3.790 |
| 2010 | $ 2.411 | $ 3.200 |
| 2009 | $ 2.256 | $ 3.002 |
| 2008 | $ 2.179 | $ 2.851 |
| 2007 | $ 1.949 | $ 2.722 |
| 2006 | $ 1.878 | $ 2.583 |
| 2005 | $ 1.783 | $ 2.461 |
| 2004 | $ 1.711 | $ 2.322 |
| 2003 | $ 1.749 | $ 2.201 |
| 2002 | $ 1.525 | $ 2.104 |
| 2001 | $ 1.371 | $ 2.021 |
| 2000 | $ 1.461 | $ 1.917 |
Os gastos com saúde por pessoa são de US$ 3.922 em Singapura e de US$ 3.638 no Japão: 8% a mais em Singapura. Em 2000, foram de US$ 796 em Singapura e de US$ 2.751 no Japão. Em paridade do poder de compra, são de 6.551 $ PPC em Singapura e de 5.365 $ PPC no Japão.
Singapura vs Japão: gastos com saúde por pessoa mais recentes e quem paga (% dos gastos correntes com saúde)
|
Singapura
|
Japão
|
|
|---|---|---|
| US$ por pessoa | US$ 3.922 (2023) | US$ 3.638 (2023) |
| $ PPC por pessoa | 6.551 $ PPC (2023) | 5.365 $ PPC (2023) |
| Posição mundial | 23/192 | 24/192 |
| Governo | 58,5% (2023) | 84,8% (2023) |
| Pagamento direto | 25,4% (2023) | 12,2% (2023) |
| Outros privados | 16,1% (2023) | 2,9% (2023) |
Comparar os gastos com saúde per capita de dois países
Fontes:
- Banco Mundial | Health (2000–2023, atualizado em outubro de 2026)
Creative Commons Atribuição (CC BY): você pode copiar, compartilhar, adaptar e reutilizar este conteúdo, inclusive para fins comerciais, desde que cite o statistics.wiki e indique as alterações que fizer. As fontes listadas acima podem ter suas próprias condições de licença.