
Japão vs Israel: gráficos dos gastos com saúde por pessoa, US$ e $ PPC
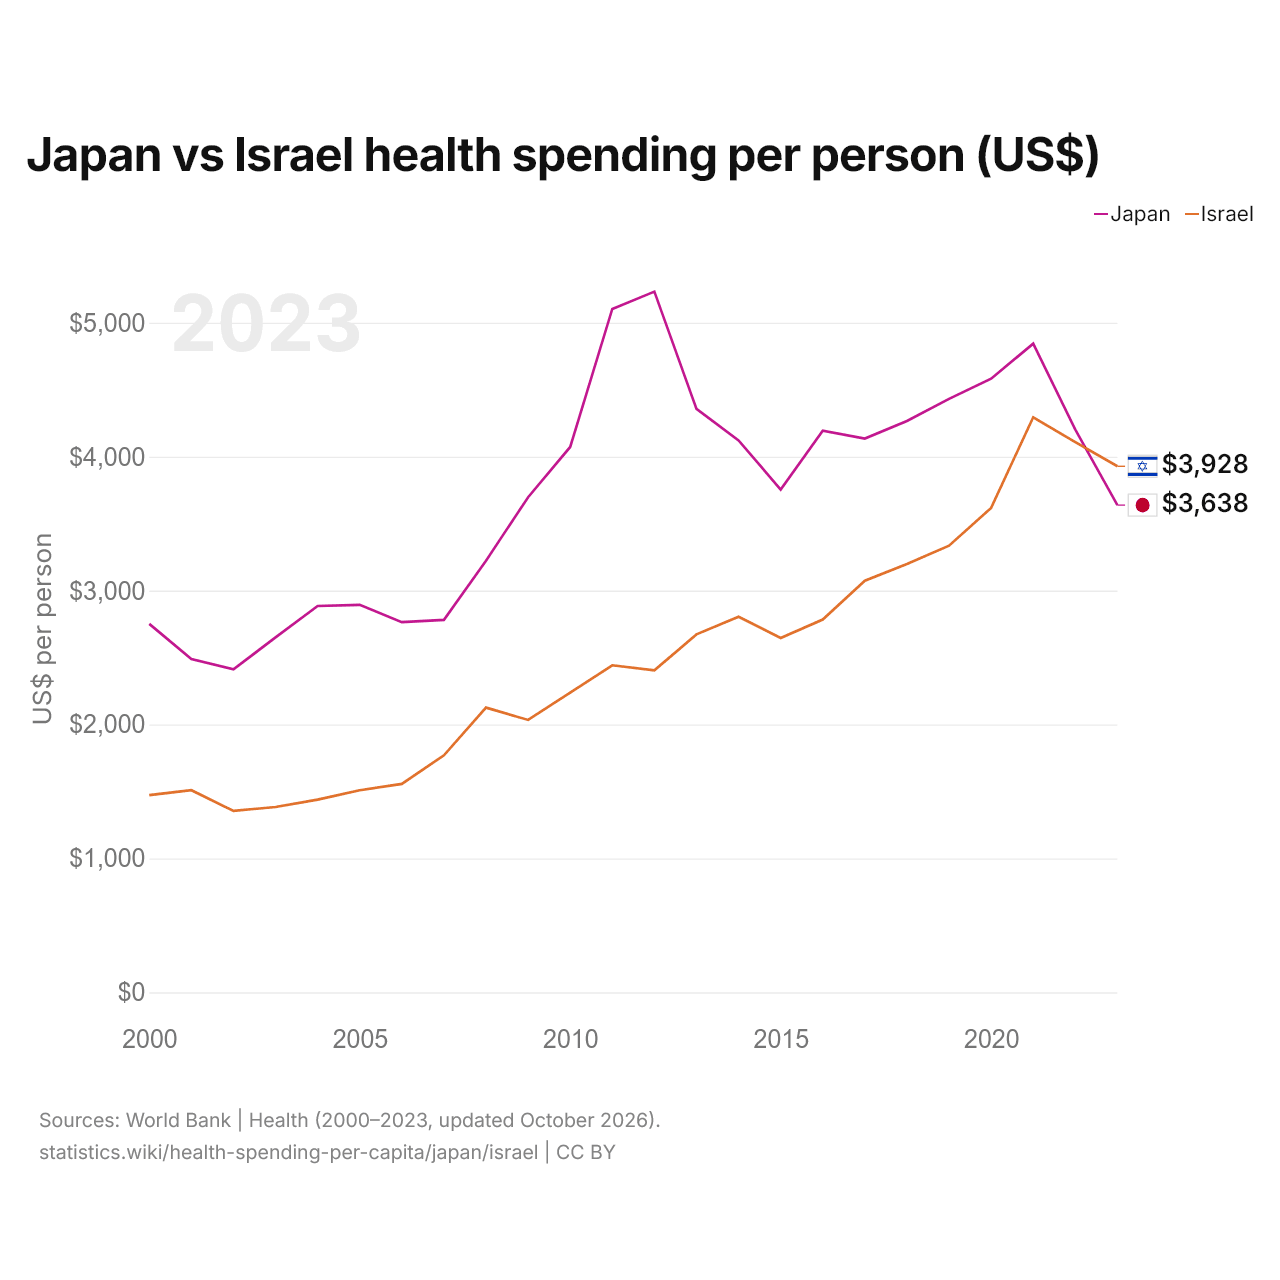
1x
| Ano | US$ por pessoa | |
|---|---|---|
 Japão |
 Israel |
|
| 2023 | US$ 3.638 | US$ 3.928 |
| 2022 | US$ 4.202 | US$ 4.108 |
| 2021 | US$ 4.844 | US$ 4.294 |
| 2020 | US$ 4.582 | US$ 3.617 |
| 2019 | US$ 4.431 | US$ 3.335 |
| 2018 | US$ 4.266 | US$ 3.199 |
| 2017 | US$ 4.135 | US$ 3.074 |
| 2016 | US$ 4.194 | US$ 2.784 |
| 2015 | US$ 3.754 | US$ 2.646 |
| 2014 | US$ 4.121 | US$ 2.804 |
| 2013 | US$ 4.356 | US$ 2.673 |
| 2012 | US$ 5.232 | US$ 2.405 |
| 2011 | US$ 5.103 | US$ 2.442 |
| 2010 | US$ 4.072 | US$ 2.238 |
| 2009 | US$ 3.697 | US$ 2.034 |
| 2008 | US$ 3.223 | US$ 2.126 |
| 2007 | US$ 2.781 | US$ 1.770 |
| 2006 | US$ 2.764 | US$ 1.556 |
| 2005 | US$ 2.893 | US$ 1.509 |
| 2004 | US$ 2.885 | US$ 1.439 |
| 2003 | US$ 2.650 | US$ 1.384 |
| 2002 | US$ 2.412 | US$ 1.355 |
| 2001 | US$ 2.489 | US$ 1.509 |
| 2000 | US$ 2.751 | US$ 1.473 |
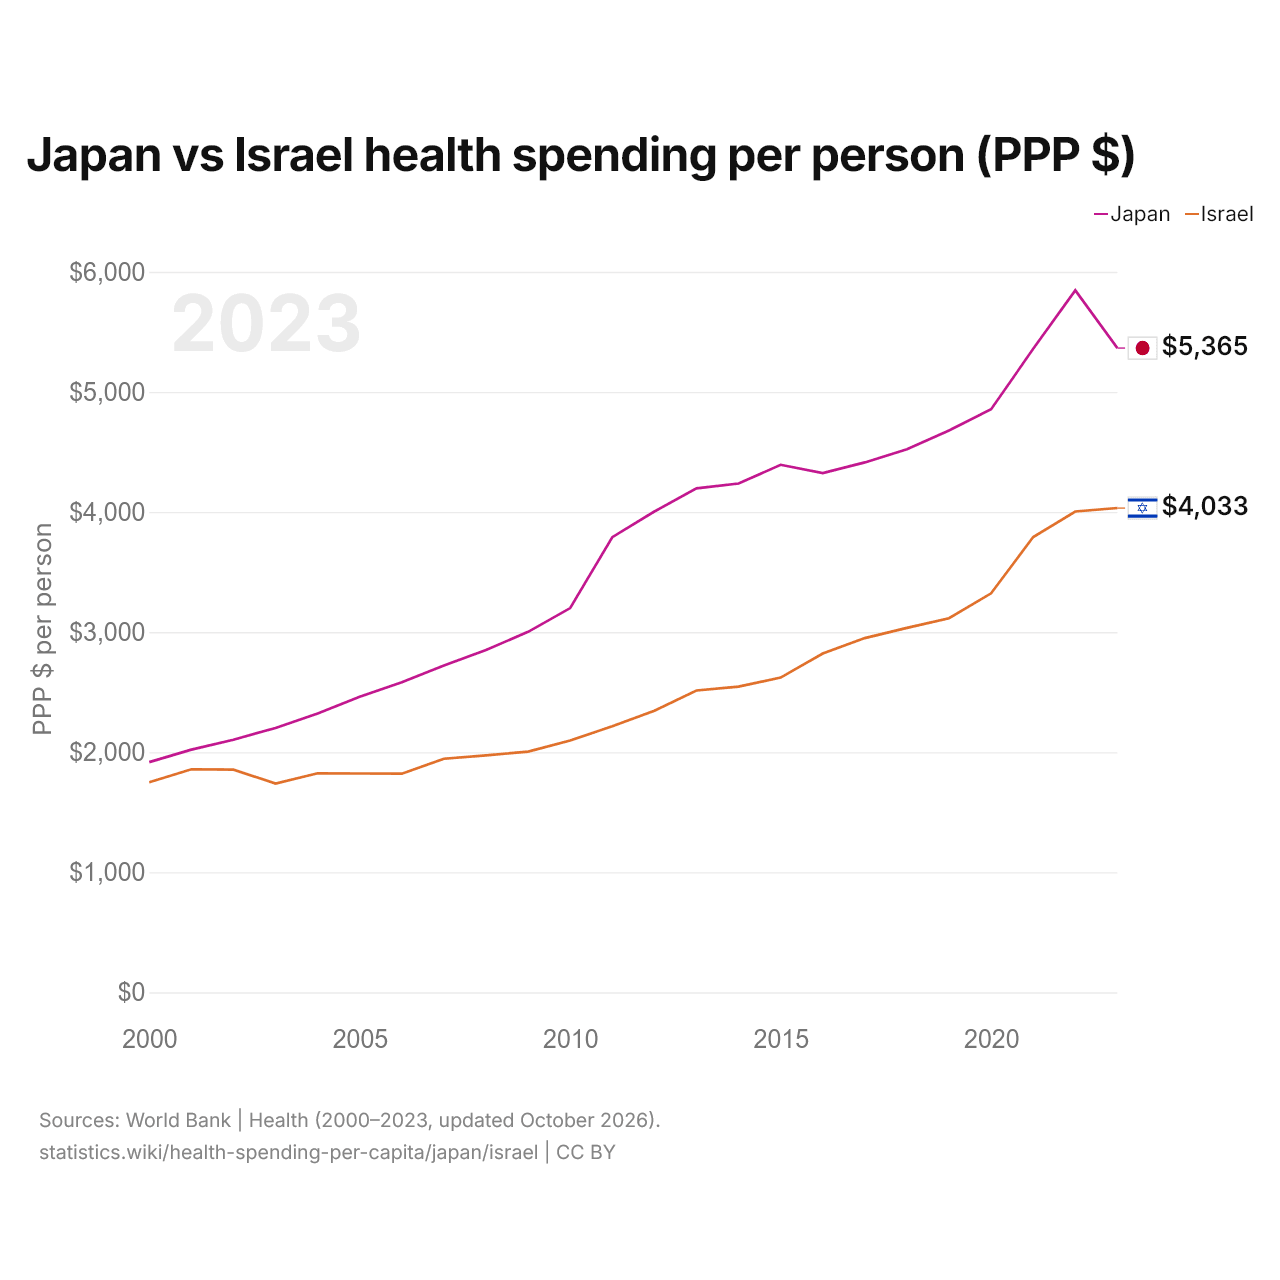
1x
| Ano | $ PPC por pessoa | |
|---|---|---|
|
Japão
|
Israel
|
|
| 2023 | $ 5.365 | $ 4.033 |
| 2022 | $ 5.846 | $ 4.004 |
| 2021 | $ 5.359 | $ 3.792 |
| 2020 | $ 4.856 | $ 3.323 |
| 2019 | $ 4.679 | $ 3.115 |
| 2018 | $ 4.522 | $ 3.035 |
| 2017 | $ 4.413 | $ 2.950 |
| 2016 | $ 4.324 | $ 2.822 |
| 2015 | $ 4.393 | $ 2.621 |
| 2014 | $ 4.237 | $ 2.546 |
| 2013 | $ 4.197 | $ 2.514 |
| 2012 | $ 4.004 | $ 2.345 |
| 2011 | $ 3.790 | $ 2.215 |
| 2010 | $ 3.200 | $ 2.097 |
| 2009 | $ 3.002 | $ 2.005 |
| 2008 | $ 2.851 | $ 1.973 |
| 2007 | $ 2.722 | $ 1.945 |
| 2006 | $ 2.583 | $ 1.821 |
| 2005 | $ 2.461 | $ 1.822 |
| 2004 | $ 2.322 | $ 1.824 |
| 2003 | $ 2.201 | $ 1.739 |
| 2002 | $ 2.104 | $ 1.854 |
| 2001 | $ 2.021 | $ 1.858 |
| 2000 | $ 1.917 | $ 1.750 |
Os gastos com saúde por pessoa são de US$ 3.638 no Japão e de US$ 3.928 em Israel: 8% a mais em Israel. Em 2000, foram de US$ 2.751 no Japão e de US$ 1.473 em Israel. Em paridade do poder de compra, são de 5.365 $ PPC no Japão e de 4.033 $ PPC em Israel.
Japão vs Israel: gastos com saúde por pessoa mais recentes e quem paga (% dos gastos correntes com saúde)
|
Japão
|
Israel
|
|
|---|---|---|
| US$ por pessoa | US$ 3.638 (2023) | US$ 3.928 (2023) |
| $ PPC por pessoa | 5.365 $ PPC (2023) | 4.033 $ PPC (2023) |
| Posição mundial | 24/192 | 21/192 |
| Governo | 84,8% (2023) | 65,2% (2023) |
| Pagamento direto | 12,2% (2023) | 20,5% (2023) |
| Outros privados | 2,9% (2023) | 12,8% (2023) |
| Ajuda externa | 0,0% (2023) | 1,4% (2023) |
Comparar os gastos com saúde per capita de dois países
Fontes:
- Banco Mundial | Health (2000–2023, atualizado em outubro de 2026)
Creative Commons Atribuição (CC BY): você pode copiar, compartilhar, adaptar e reutilizar este conteúdo, inclusive para fins comerciais, desde que cite o statistics.wiki e indique as alterações que fizer. As fontes listadas acima podem ter suas próprias condições de licença.