
Nicarágua vs Brasil: PIB, 1960–2025
1x
| Ano | PIB, US$ correntes | |
|---|---|---|
 Nicarágua |
 Brasil |
|
| 2025 | US$ 22.237.167.113 | US$ 2.279.920.092.492 |
| 2024 | US$ 19.696.311.850 | US$ 2.185.821.610.689 |
| 2023 | US$ 17.805.842.221 | US$ 2.191.131.765.685 |
| 2022 | US$ 15.634.573.556 | US$ 1.951.923.942.083 |
| 2021 | US$ 14.209.019.392 | US$ 1.670.647.398.905 |
| 2020 | US$ 12.726.422.432 | US$ 1.476.107.231.310 |
| 2019 | US$ 12.699.023.614 | US$ 1.873.288.205.060 |
| 2018 | US$ 13.025.221.974 | US$ 1.916.933.898.011 |
| 2017 | US$ 13.785.893.007 | US$ 2.063.514.977.366 |
| 2016 | US$ 13.286.093.388 | US$ 1.795.693.482.853 |
| 2015 | US$ 12.756.696.261 | US$ 1.802.212.206.815 |
| 2014 | US$ 11.880.438.824 | US$ 2.456.043.727.199 |
| 2013 | US$ 10.982.988.249 | US$ 2.472.819.535.557 |
| 2012 | US$ 10.532.017.232 | US$ 2.465.227.802.807 |
| 2011 | US$ 9.774.329.333 | US$ 2.616.156.223.918 |
| 2010 | US$ 8.758.602.233 | US$ 2.208.837.745.101 |
| 2009 | US$ 8.298.702.489 | US$ 1.666.996.438.581 |
| 2008 | US$ 8.496.967.597 | US$ 1.695.855.083.498 |
| 2007 | US$ 7.423.375.015 | US$ 1.397.114.486.369 |
| 2006 | US$ 6.763.672.381 | US$ 1.107.626.541.435 |
| 2005 | US$ 6.321.324.279 | US$ 891.633.839.894 |
| 2004 | US$ 5.792.932.838 | US$ 669.289.424.806 |
| 2003 | US$ 5.322.228.351 | US$ 558.233.745.652 |
| 2002 | US$ 5.223.727.303 | US$ 509.795.273.807 |
| 2001 | US$ 5.351.752.034 | US$ 559.983.634.799 |
| 2000 | US$ 5.109.587.050 | US$ 655.448.231.984 |
| 1999 | US$ 4.856.026.259 | US$ 599.642.024.320 |
| 1998 | US$ 4.635.347.386 | US$ 863.710.759.256 |
| 1997 | US$ 4.389.973.490 | US$ 883.206.179.730 |
| 1996 | US$ 4.308.351.903 | US$ 850.426.432.992 |
| 1995 | US$ 4.140.470.000 | US$ 769.333.050.987 |
| 1994 | US$ 3.863.185.119 | US$ 525.369.467.296 |
| 1993 | US$ 1.756.454.248 | US$ 368.292.034.381 |
| 1992 | US$ 1.792.800.000 | US$ 328.191.909.882 |
| 1991 | US$ 1.488.804.124 | US$ 342.534.090.909 |
| 1990 | US$ 1.009.455.484 | US$ 384.959.818.182 |
| 1989 | US$ 1.013.184.756 | US$ 412.990.820.287 |
| 1988 | US$ 2.630.900.096 | US$ 307.881.930.752 |
| 1987 | US$ 3.851.200.118 | US$ 283.056.836.894 |
| 1986 | US$ 2.885.799.994 | US$ 256.480.852.471 |
| 1985 | US$ 2.683.699.935 | US$ 210.879.844.639 |
| 1984 | US$ 3.117.599.872 | US$ 188.339.974.087 |
| 1983 | US$ 2.753.100.058 | US$ 189.656.506.321 |
| 1982 | US$ 2.454.499.872 | US$ 271.314.113.768 |
| 1981 | US$ 2.474.700.227 | US$ 258.015.174.749 |
| 1980 | US$ 2.144.300.006 | US$ 237.393.489.893 |
| 1979 | US$ 1.567.599.982 | US$ 221.338.204.480 |
| 1978 | US$ 2.127.699.979 | US$ 200.278.646.124 |
| 1977 | US$ 2.226.999.874 | US$ 176.344.101.402 |
| 1976 | US$ 1.836.899.999 | US$ 153.168.949.208 |
| 1975 | US$ 1.581.599.959 | US$ 129.203.555.239 |
| 1974 | US$ 1.521.400.012 | US$ 109.794.519.728 |
| 1973 | US$ 1.092.900.015 | US$ 83.592.275.863 |
| 1972 | US$ 878.570.045 | US$ 58.434.858.375 |
| 1971 | US$ 828.569.953 | US$ 48.869.830.902 |
| 1970 | US$ 778.569.939 | US$ 42.327.664.794 |
| 1969 | US$ 750.000.003 | US$ 37.171.640.819 |
| 1968 | US$ 692.859.985 | US$ 33.930.457.425 |
| 1967 | US$ 657.140.011 | US$ 31.086.389.195 |
| 1966 | US$ 607.140.010 | US$ 28.283.323.733 |
| 1965 | US$ 564.290.020 | US$ 22.465.522.884 |
| 1964 | US$ 347.119.918 | US$ 20.963.733.695 |
| 1963 | US$ 297.324.163 | US$ 23.287.712.878 |
| 1962 | US$ 269.283.804 | US$ 19.231.747.852 |
| 1961 | US$ 244.144.237 | US$ 17.275.940.449 |
| 1960 | US$ 227.223.322 | US$ 17.030.465.539 |
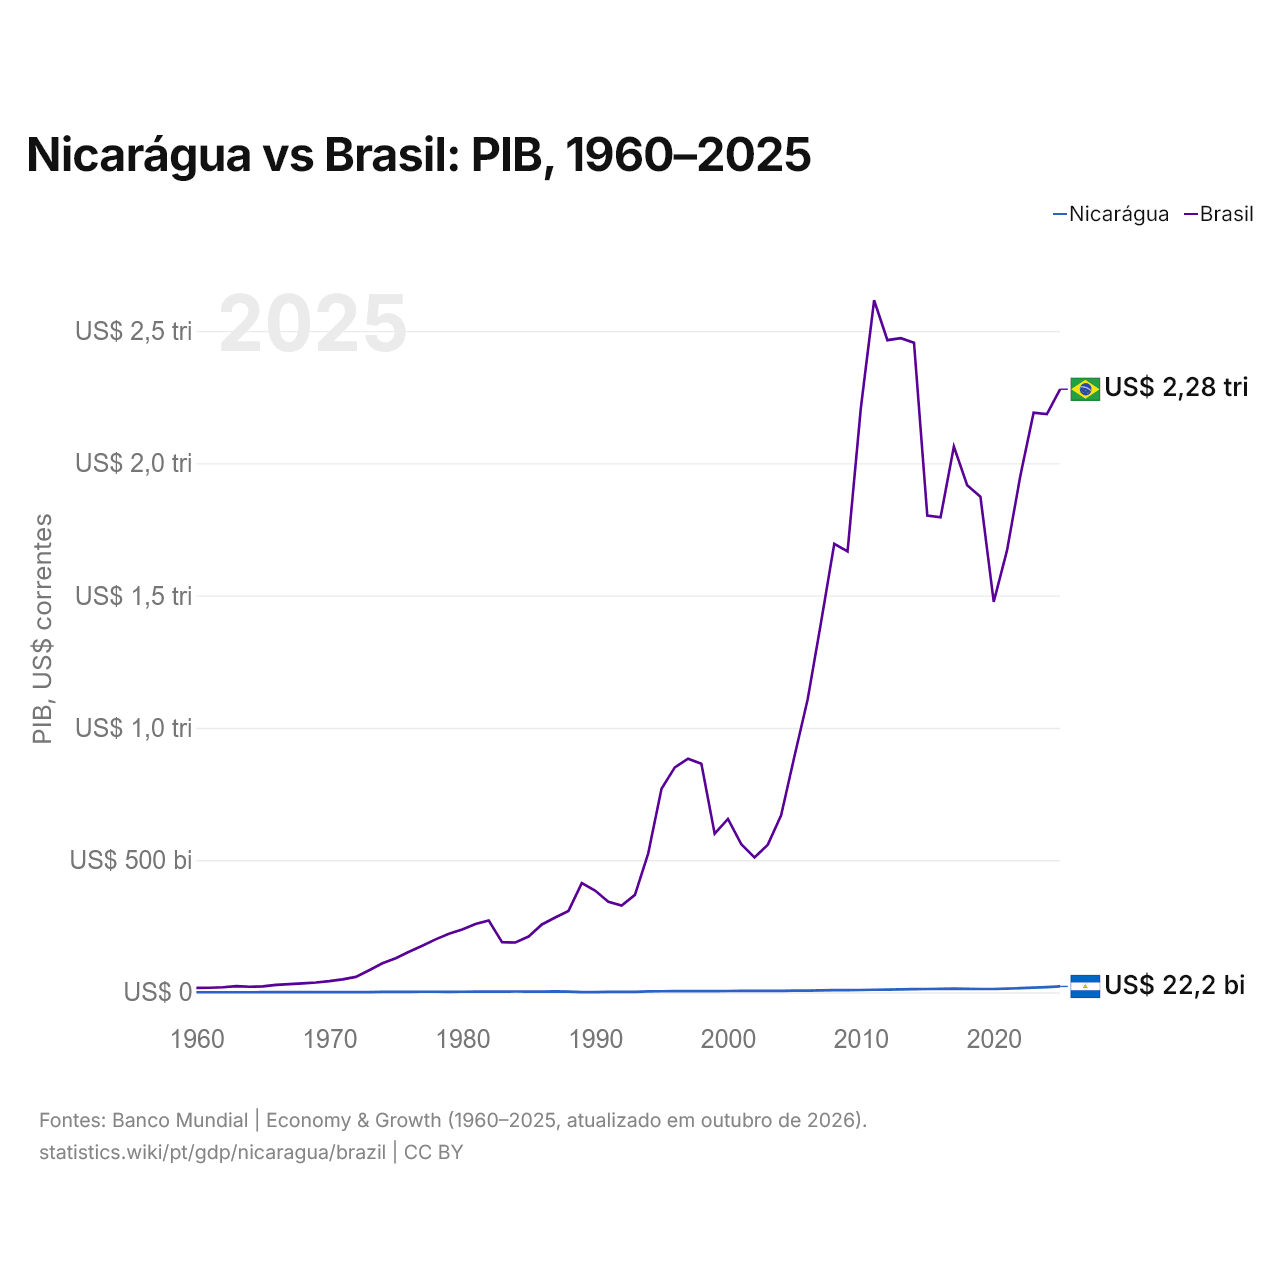
Em 2025, o PIB do Brasil (US$ 2,28 trilhões) foi 100 vezes o da Nicarágua (US$ 22,2 bilhões). Em 2015, era 140 vezes. De 2015 a 2025, a preços constantes de 2015, o PIB do Brasil cresceu 15,1% e o da Nicarágua, 30,3%.
Desde 1960, o PIB do Brasil foi o maior dos dois todos os anos; em 1960, era 75 vezes o da Nicarágua. Em 2025, o PIB per capita foi de US$ 3.173 na Nicarágua e de US$ 10.713 no Brasil, 3,4 vezes maior no Brasil.
Nicarágua vs Brasil: dados mais recentes do PIB
|
Nicarágua
|
Brasil
|
|
|---|---|---|
| PIB, US$ correntes | US$ 22,2 bi | US$ 2,28 tri |
| Posição mundial | 128/197 | 11/197 |
| Participação mundial | 0,02% | 1,93% |
| PIB, US$ constantes de 2015 | US$ 16,6 bi | US$ 2,07 tri |
| Diferença de PIB | 0,0098× | 103× |
Comparar o PIB de 2 países quaisquer
Fontes:
- Banco Mundial | Economy & Growth (1960–2025, atualizado em outubro de 2026)
Creative Commons Atribuição (CC BY): você pode copiar, compartilhar, adaptar e reutilizar este conteúdo, inclusive para fins comerciais, desde que cite o statistics.wiki e indique as alterações que fizer. As fontes listadas acima podem ter suas próprias condições de licença.