
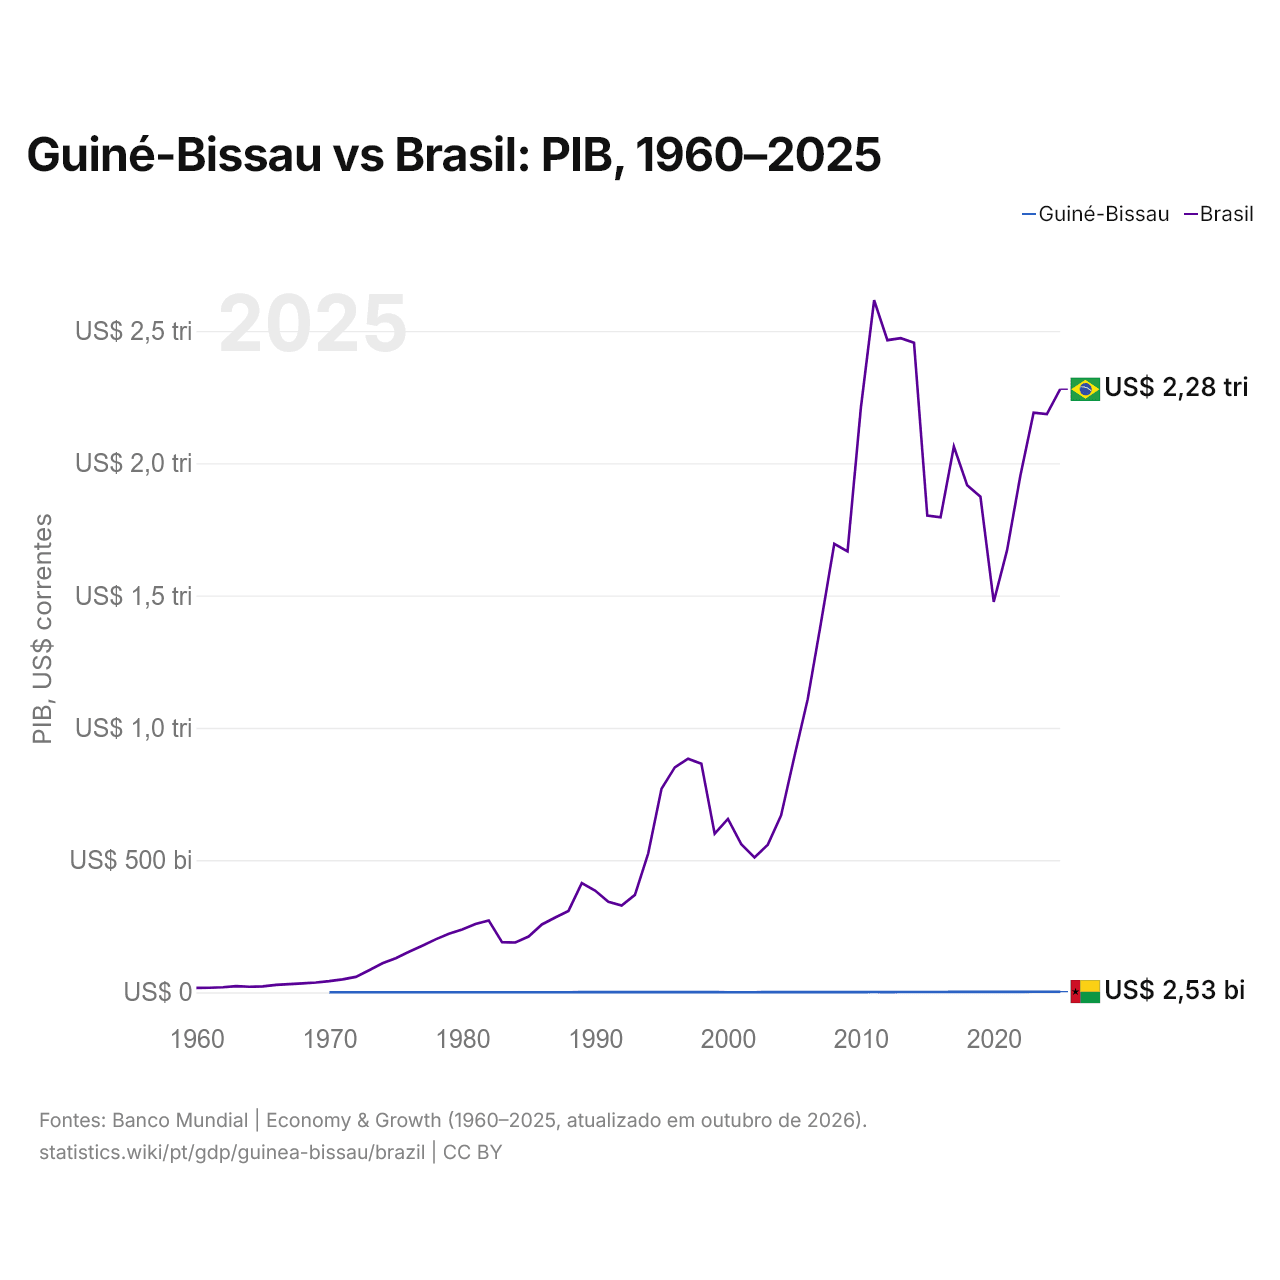
Guiné-Bissau vs Brasil: PIB, 1960–2025
| Ano | PIB, US$ correntes | |
|---|---|---|
 Guiné-Bissau |
 Brasil |
|
| 2025 | US$ 2.527.930.273 | US$ 2.279.920.092.492 |
| 2024 | US$ 2.197.777.210 | US$ 2.185.821.610.689 |
| 2023 | US$ 2.076.748.678 | US$ 2.191.131.765.685 |
| 2022 | US$ 1.856.239.955 | US$ 1.951.923.942.083 |
| 2021 | US$ 1.907.611.288 | US$ 1.670.647.398.905 |
| 2020 | US$ 1.705.062.170 | US$ 1.476.107.231.310 |
| 2019 | US$ 1.596.214.680 | US$ 1.873.288.205.060 |
| 2018 | US$ 1.554.133.594 | US$ 1.916.933.898.011 |
| 2017 | US$ 1.469.978.606 | US$ 2.063.514.977.366 |
| 2016 | US$ 1.245.074.264 | US$ 1.795.693.482.853 |
| 2015 | US$ 1.152.384.167 | US$ 1.802.212.206.815 |
| 2014 | US$ 1.135.250.721 | US$ 2.456.043.727.199 |
| 2013 | US$ 1.109.682.824 | US$ 2.472.819.535.557 |
| 2012 | US$ 1.049.412.177 | US$ 2.465.227.802.807 |
| 2011 | US$ 1.157.074.319 | US$ 2.616.156.223.918 |
| 2010 | US$ 940.112.539 | US$ 2.208.837.745.101 |
| 2009 | US$ 890.167.833 | US$ 1.666.996.438.581 |
| 2008 | US$ 952.667.544 | US$ 1.695.855.083.498 |
| 2007 | US$ 753.162.998 | US$ 1.397.114.486.369 |
| 2006 | US$ 634.781.901 | US$ 1.107.626.541.435 |
| 2005 | US$ 639.776.041 | US$ 891.633.839.894 |
| 2004 | US$ 582.169.841 | US$ 669.289.424.806 |
| 2003 | US$ 553.614.800 | US$ 558.233.745.652 |
| 2002 | US$ 466.773.711 | US$ 509.795.273.807 |
| 2001 | US$ 412.610.872 | US$ 559.983.634.799 |
| 2000 | US$ 391.345.597 | US$ 655.448.231.984 |
| 1999 | US$ 579.365.780 | US$ 599.642.024.320 |
| 1998 | US$ 591.034.143 | US$ 863.710.759.256 |
| 1997 | US$ 698.107.222 | US$ 883.206.179.730 |
| 1996 | US$ 702.965.148 | US$ 850.426.432.992 |
| 1995 | US$ 660.195.402 | US$ 769.333.050.987 |
| 1994 | US$ 612.502.085 | US$ 525.369.467.296 |
| 1993 | US$ 615.779.519 | US$ 368.292.034.381 |
| 1992 | US$ 588.309.271 | US$ 328.191.909.882 |
| 1991 | US$ 668.470.891 | US$ 342.534.090.909 |
| 1990 | US$ 634.187.269 | US$ 384.959.818.182 |
| 1989 | US$ 554.072.303 | US$ 412.990.820.287 |
| 1988 | US$ 427.514.322 | US$ 307.881.930.752 |
| 1987 | US$ 451.893.375 | US$ 283.056.836.894 |
| 1986 | US$ 338.524.233 | US$ 256.480.852.471 |
| 1985 | US$ 373.959.151 | US$ 210.879.844.639 |
| 1984 | US$ 359.980.491 | US$ 188.339.974.087 |
| 1983 | US$ 425.225.177 | US$ 189.656.506.321 |
| 1982 | US$ 430.284.022 | US$ 271.314.113.768 |
| 1981 | US$ 402.230.865 | US$ 258.015.174.749 |
| 1980 | US$ 287.648.258 | US$ 237.393.489.893 |
| 1979 | US$ 308.143.183 | US$ 221.338.204.480 |
| 1978 | US$ 318.876.550 | US$ 200.278.646.124 |
| 1977 | US$ 298.871.675 | US$ 176.344.101.402 |
| 1976 | US$ 292.152.321 | US$ 153.168.949.208 |
| 1975 | US$ 283.311.997 | US$ 129.203.555.239 |
| 1974 | US$ 256.769.730 | US$ 109.794.519.728 |
| 1973 | US$ 232.331.281 | US$ 83.592.275.863 |
| 1972 | US$ 227.986.203 | US$ 58.434.858.375 |
| 1971 | US$ 204.167.297 | US$ 48.869.830.902 |
| 1970 | US$ 204.670.551 | US$ 42.327.664.794 |
| 1969 | - | US$ 37.171.640.819 |
| 1968 | - | US$ 33.930.457.425 |
| 1967 | - | US$ 31.086.389.195 |
| 1966 | - | US$ 28.283.323.733 |
| 1965 | - | US$ 22.465.522.884 |
| 1964 | - | US$ 20.963.733.695 |
| 1963 | - | US$ 23.287.712.878 |
| 1962 | - | US$ 19.231.747.852 |
| 1961 | - | US$ 17.275.940.449 |
| 1960 | - | US$ 17.030.465.539 |
Em 2025, o PIB do Brasil (US$ 2,28 trilhões) foi 900 vezes o da Guiné-Bissau (US$ 2,53 bilhões). Em 2015, era 1.600 vezes. De 2015 a 2025, a preços constantes de 2015, o PIB do Brasil cresceu 15,1% e o da Guiné-Bissau, 58,9%.
Desde 1970, o PIB do Brasil foi o maior dos dois todos os anos; em 1970, era 210 vezes o da Guiné-Bissau. Em 2025, o PIB per capita foi de US$ 1.124 na Guiné-Bissau e de US$ 10.713 no Brasil, 9,5 vezes maior no Brasil.
Guiné-Bissau vs Brasil: dados mais recentes do PIB
|
Guiné-Bissau
|
Brasil
|
|
|---|---|---|
| PIB, US$ correntes | US$ 2,53 bi | US$ 2,28 tri |
| Posição mundial | 176/197 | 11/197 |
| Participação mundial | 0,002% | 1,93% |
| PIB, US$ constantes de 2015 | US$ 1,83 bi | US$ 2,07 tri |
| Diferença de PIB | 0,0011× | 902× |
Comparar o PIB de 2 países quaisquer
Fontes:
- Banco Mundial | Economy & Growth (1960–2025, atualizado em outubro de 2026)
Creative Commons Atribuição (CC BY): você pode copiar, compartilhar, adaptar e reutilizar este conteúdo, inclusive para fins comerciais, desde que cite o statistics.wiki e indique as alterações que fizer. As fontes listadas acima podem ter suas próprias condições de licença.