
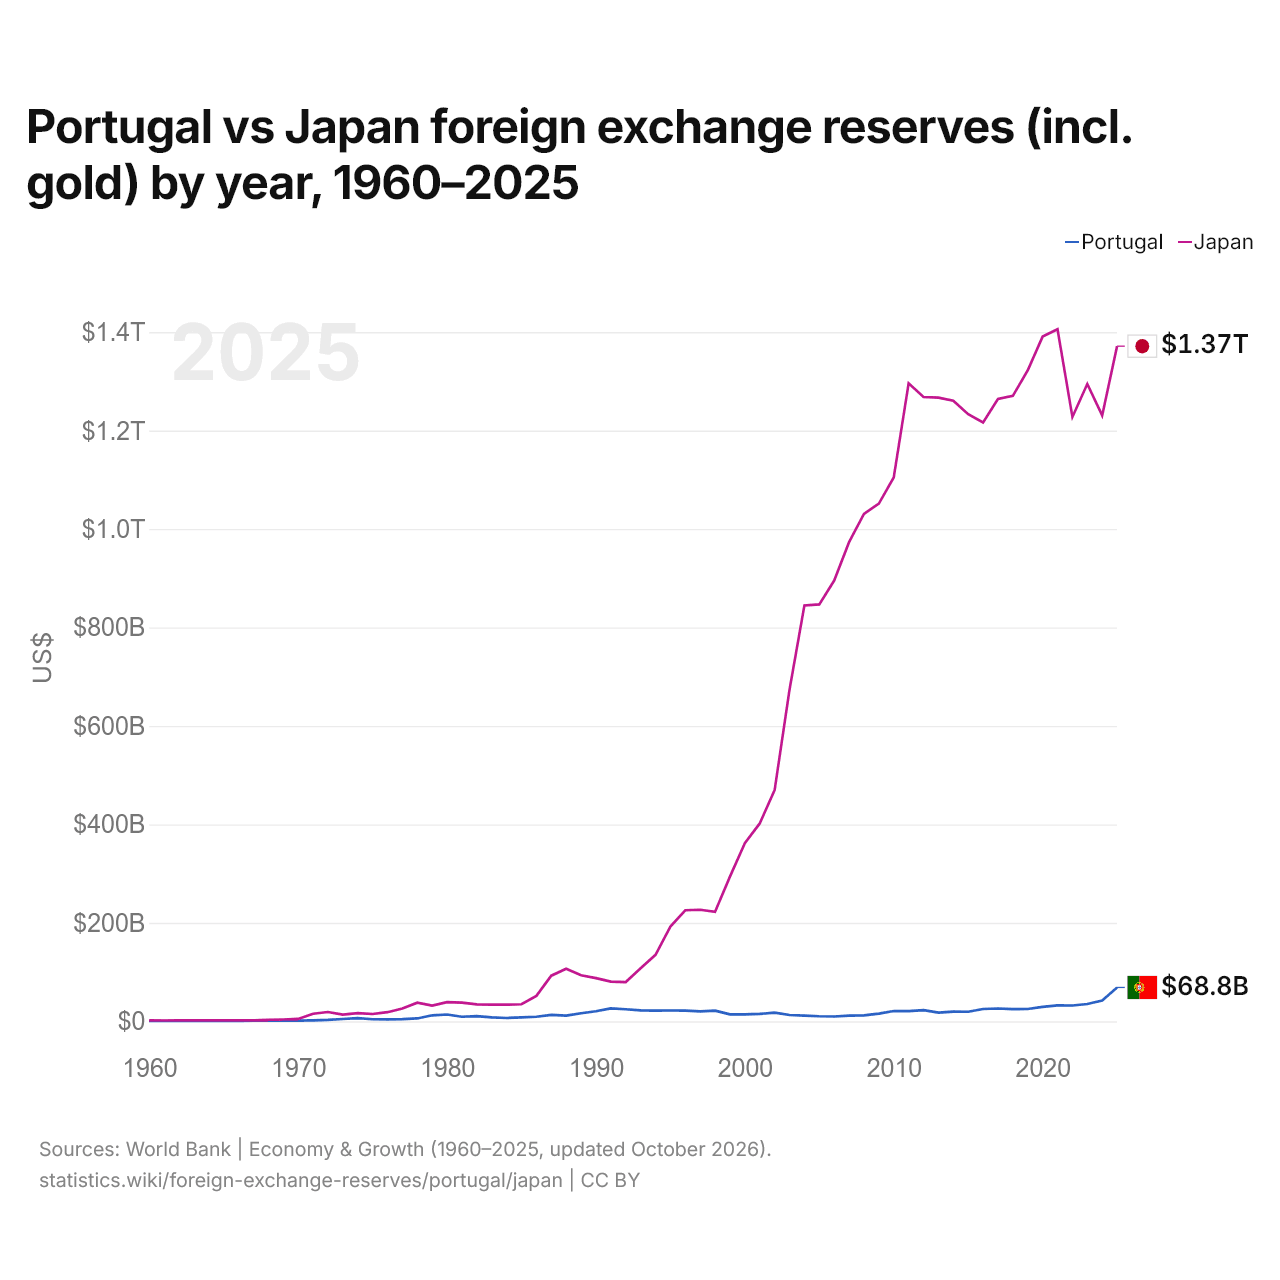
Portugal vs Japão: reservas internacionais (incluindo ouro) por ano, 1960–2025
1x
| Ano | US$ | |
|---|---|---|
 Portugal |
 Japão |
|
| 2025 | US$ 68.839.157.118 | US$ 1.371.402.218.768 |
| 2024 | US$ 42.434.283.511 | US$ 1.230.666.979.042 |
| 2023 | US$ 35.242.560.648 | US$ 1.294.636.035.264 |
| 2022 | US$ 32.231.572.059 | US$ 1.227.573.263.129 |
| 2021 | US$ 32.535.115.418 | US$ 1.405.748.991.419 |
| 2020 | US$ 29.459.811.843 | US$ 1.390.808.939.303 |
| 2019 | US$ 25.002.862.228 | US$ 1.322.443.255.599 |
| 2018 | US$ 24.920.338.987 | US$ 1.270.467.038.787 |
| 2017 | US$ 26.096.701.287 | US$ 1.264.140.980.384 |
| 2016 | US$ 24.989.773.865 | US$ 1.216.518.779.920 |
| 2015 | US$ 19.402.623.792 | US$ 1.233.097.790.282 |
| 2014 | US$ 19.700.737.012 | US$ 1.260.680.310.063 |
| 2013 | US$ 17.589.253.885 | US$ 1.266.851.401.020 |
| 2012 | US$ 22.658.232.426 | US$ 1.268.085.524.238 |
| 2011 | US$ 20.801.304.307 | US$ 1.295.838.676.317 |
| 2010 | US$ 20.936.757.462 | US$ 1.104.563.760.972 |
| 2009 | US$ 15.781.930.171 | US$ 1.051.654.952.502 |
| 2008 | US$ 12.006.451.709 | US$ 1.030.762.755.205 |
| 2007 | US$ 11.512.068.377 | US$ 973.296.740.493 |
| 2006 | US$ 9.882.747.256 | US$ 895.321.278.050 |
| 2005 | US$ 10.364.170.168 | US$ 846.895.906.145 |
| 2004 | US$ 11.684.065.091 | US$ 844.667.163.385 |
| 2003 | US$ 12.813.462.308 | US$ 673.554.461.759 |
| 2002 | US$ 17.700.956.382 | US$ 469.618.129.428 |
| 2001 | US$ 15.060.281.506 | US$ 401.957.624.245 |
| 2000 | US$ 14.262.113.157 | US$ 361.639.097.012 |
| 1999 | US$ 14.088.450.971 | US$ 293.948.150.986 |
| 1998 | US$ 21.606.105.341 | US$ 222.443.261.241 |
| 1997 | US$ 20.322.803.841 | US$ 226.679.071.030 |
| 1996 | US$ 21.850.466.132 | US$ 225.593.968.190 |
| 1995 | US$ 22.063.365.760 | US$ 192.619.707.815 |
| 1994 | US$ 21.670.533.105 | US$ 135.145.568.171 |
| 1993 | US$ 22.115.180.395 | US$ 107.988.991.686 |
| 1992 | US$ 24.481.230.706 | US$ 79.696.681.098 |
| 1991 | US$ 26.239.358.014 | US$ 80.625.862.247 |
| 1990 | US$ 20.578.947.935 | US$ 87.828.344.748 |
| 1989 | US$ 16.388.652.067 | US$ 93.672.792.067 |
| 1988 | US$ 11.719.331.742 | US$ 106.667.696.598 |
| 1987 | US$ 13.039.014.495 | US$ 92.701.644.566 |
| 1986 | US$ 9.336.202.502 | US$ 51.727.340.940 |
| 1985 | US$ 8.008.241.510 | US$ 34.641.191.189 |
| 1984 | US$ 6.773.536.263 | US$ 33.898.635.723 |
| 1983 | US$ 8.180.649.541 | US$ 33.844.570.859 |
| 1982 | US$ 10.540.549.467 | US$ 34.403.722.657 |
| 1981 | US$ 9.334.151.674 | US$ 37.839.021.738 |
| 1980 | US$ 13.862.932.271 | US$ 38.918.853.640 |
| 1979 | US$ 12.262.027.703 | US$ 31.926.247.771 |
| 1978 | US$ 5.873.321.282 | US$ 37.824.760.300 |
| 1977 | US$ 4.342.230.245 | US$ 25.907.718.768 |
| 1976 | US$ 3.904.791.954 | US$ 18.590.786.441 |
| 1975 | US$ 4.285.387.933 | US$ 14.910.844.574 |
| 1974 | US$ 6.353.120.252 | US$ 16.551.249.546 |
| 1973 | US$ 4.767.686.793 | US$ 13.723.926.171 |
| 1972 | US$ 3.034.003.805 | US$ 18.932.680.017 |
| 1971 | US$ 2.092.684.248 | US$ 15.469.152.225 |
| 1970 | US$ 1.564.794.900 | US$ 4.876.114.550 |
| 1969 | US$ 1.449.770.000 | US$ 3.656.226.000 |
| 1968 | US$ 1.531.644.000 | US$ 2.976.246.800 |
| 1967 | US$ 1.237.714.000 | US$ 2.032.436.400 |
| 1966 | US$ 1.080.200.300 | US$ 2.121.519.420 |
| 1965 | US$ 1.011.085.200 | US$ 2.153.610.240 |
| 1964 | US$ 955.702.800 | US$ 2.020.624.000 |
| 1963 | US$ 843.136.000 | US$ 2.059.016.360 |
| 1962 | US$ 808.042.200 | US$ 2.021.337.500 |
| 1961 | US$ 693.999.000 | US$ 1.667.124.550 |
| 1960 | US$ 801.276.000 | US$ 1.953.371.600 |
Em 2025, as reservas internacionais de Portugal foram de US$ 68,8 bilhões e as do Japão, de US$ 1,37 trilhão: as do Japão foram 20 vezes maiores. Em 1960, as reservas do Japão foram 2,4 vezes maiores: US$ 801 milhões de Portugal e US$ 1,95 bilhão do Japão.
As reservas internacionais do Japão têm sido maiores que as de Portugal todos os anos desde 1960.
Portugal vs Japão: reservas, incluindo ouro, e meses de importações cobertos
|
Portugal
|
Japão
|
|
|---|---|---|
| Reservas, incluindo ouro | US$ 68,8 bi | US$ 1,37 tri |
| Meses de importações | 5,6 | 16,5 |
| Posição mundial | 39/168 | 3/168 |
| Diferença das reservas | 0,05× | 20× |
Comparar as reservas internacionais de 2 países quaisquer
Fontes:
- Banco Mundial | Economy & Growth (1960–2025, atualizado em outubro de 2026)
Creative Commons Atribuição (CC BY): você pode copiar, compartilhar, adaptar e reutilizar este conteúdo, inclusive para fins comerciais, desde que cite o statistics.wiki e indique as alterações que fizer. As fontes listadas acima podem ter suas próprias condições de licença.