
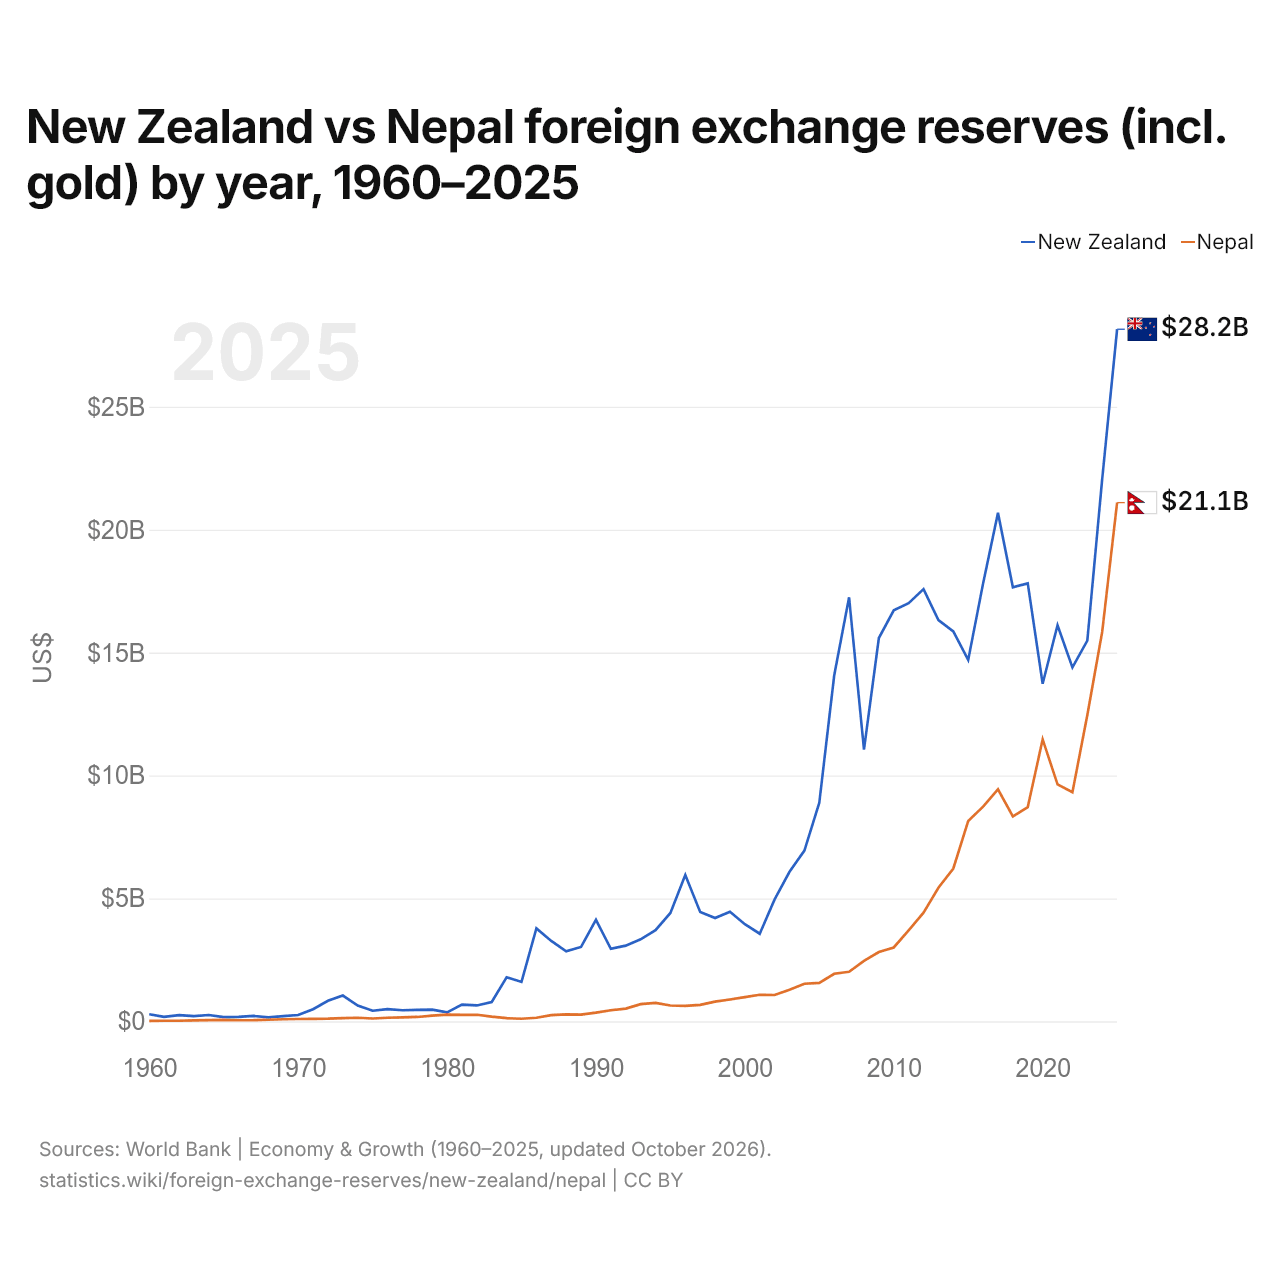
Nova Zelândia vs Nepal: reservas internacionais (incluindo ouro) por ano, 1960–2025
1x
| Ano | US$ | |
|---|---|---|
 Nova Zelândia |
 Nepal |
|
| 2025 | US$ 28.152.498.624 | US$ 21.100.332.322 |
| 2024 | US$ 22.065.156.554 | US$ 15.846.781.299 |
| 2023 | US$ 15.487.380.828 | US$ 12.456.122.669 |
| 2022 | US$ 14.399.554.617 | US$ 9.319.150.273 |
| 2021 | US$ 16.113.750.240 | US$ 9.638.842.484 |
| 2020 | US$ 13.733.288.689 | US$ 11.467.799.302 |
| 2019 | US$ 17.813.501.891 | US$ 8.713.166.195 |
| 2018 | US$ 17.656.593.020 | US$ 8.335.473.017 |
| 2017 | US$ 20.683.740.691 | US$ 9.435.255.967 |
| 2016 | US$ 17.808.384.490 | US$ 8.734.510.299 |
| 2015 | US$ 14.699.798.263 | US$ 8.145.463.908 |
| 2014 | US$ 15.861.069.905 | US$ 6.216.255.070 |
| 2013 | US$ 16.317.764.963 | US$ 5.434.181.403 |
| 2012 | US$ 17.582.960.688 | US$ 4.417.738.496 |
| 2011 | US$ 17.011.945.022 | US$ 3.702.502.162 |
| 2010 | US$ 16.722.654.736 | US$ 3.002.724.838 |
| 2009 | US$ 15.594.002.509 | US$ 2.819.466.154 |
| 2008 | US$ 11.052.155.510 | US$ 2.457.914.115 |
| 2007 | US$ 17.247.175.110 | US$ 2.014.032.856 |
| 2006 | US$ 14.068.475.834 | US$ 1.935.487.673 |
| 2005 | US$ 8.892.727.558 | US$ 1.565.203.520 |
| 2004 | US$ 6.947.354.918 | US$ 1.529.099.986 |
| 2003 | US$ 6.085.430.342 | US$ 1.286.240.900 |
| 2002 | US$ 4.962.816.762 | US$ 1.070.003.807 |
| 2001 | US$ 3.564.653.927 | US$ 1.079.959.914 |
| 2000 | US$ 3.952.081.062 | US$ 987.342.047 |
| 1999 | US$ 4.455.337.955 | US$ 889.429.673 |
| 1998 | US$ 4.203.708.705 | US$ 800.272.085 |
| 1997 | US$ 4.451.316.560 | US$ 670.587.740 |
| 1996 | US$ 5.953.469.110 | US$ 627.771.666 |
| 1995 | US$ 4.409.840.589 | US$ 645.536.746 |
| 1994 | US$ 3.708.505.758 | US$ 752.158.919 |
| 1993 | US$ 3.337.384.444 | US$ 699.898.113 |
| 1992 | US$ 3.079.489.190 | US$ 518.336.214 |
| 1991 | US$ 2.950.278.021 | US$ 450.982.960 |
| 1990 | US$ 4.129.354.287 | US$ 354.107.095 |
| 1989 | US$ 3.027.432.007 | US$ 272.846.716 |
| 1988 | US$ 2.845.129.943 | US$ 282.826.478 |
| 1987 | US$ 3.270.435.793 | US$ 251.413.397 |
| 1986 | US$ 3.779.914.173 | US$ 145.886.829 |
| 1985 | US$ 1.603.038.945 | US$ 105.467.402 |
| 1984 | US$ 1.793.573.440 | US$ 128.600.058 |
| 1983 | US$ 786.180.150 | US$ 191.064.674 |
| 1982 | US$ 646.131.513 | US$ 268.378.934 |
| 1981 | US$ 682.774.524 | US$ 262.066.242 |
| 1980 | US$ 365.276.663 | US$ 271.948.974 |
| 1979 | US$ 473.984.277 | US$ 235.268.995 |
| 1978 | US$ 465.822.282 | US$ 178.077.054 |
| 1977 | US$ 449.817.030 | US$ 161.385.891 |
| 1976 | US$ 493.834.469 | US$ 145.042.574 |
| 1975 | US$ 430.065.728 | US$ 113.974.569 |
| 1974 | US$ 642.844.475 | US$ 145.577.564 |
| 1973 | US$ 1.047.638.200 | US$ 132.121.707 |
| 1972 | US$ 833.644.612 | US$ 107.173.202 |
| 1971 | US$ 492.952.623 | US$ 102.268.065 |
| 1970 | US$ 257.723.142 | US$ 94.202.508 |
| 1969 | US$ 209.849.306 | US$ 83.753.427 |
| 1968 | US$ 161.709.283 | US$ 65.316.280 |
| 1967 | US$ 218.554.189 | US$ 46.384.506 |
| 1966 | US$ 179.191.434 | US$ 44.983.567 |
| 1965 | US$ 173.296.694 | US$ 59.519.654 |
| 1964 | US$ 257.817.310 | US$ 49.119.654 |
| 1963 | US$ 212.806.687 | US$ 36.256.170 |
| 1962 | US$ 250.806.531 | US$ 24.045.769 |
| 1961 | US$ 180.797.778 | US$ 24.149.980 |
| 1960 | US$ 287.599.929 | US$ 19.273.664 |
Em 2025, as reservas internacionais da Nova Zelândia foram de US$ 28,2 bilhões e as do Nepal, de US$ 21,1 bilhões: as da Nova Zelândia foram 33% maiores. Em 1960, as reservas da Nova Zelândia foram 15 vezes maiores: US$ 288 milhões da Nova Zelândia e US$ 19,3 milhões do Nepal.
As reservas internacionais da Nova Zelândia têm sido maiores que as do Nepal todos os anos desde 1960.
Nova Zelândia vs Nepal: reservas, incluindo ouro, e meses de importações cobertos
|
Nova Zelândia
|
Nepal
|
|
|---|---|---|
| Reservas, incluindo ouro | US$ 28,2 bi | US$ 21,1 bi |
| Meses de importações | 4,9 | 16,5 |
| Posição mundial | 59/168 | 65/168 |
| Diferença das reservas | 1,3× | 0,75× |
Comparar as reservas internacionais de 2 países quaisquer
Fontes:
- Banco Mundial | Economy & Growth (1960–2025, atualizado em outubro de 2026)
Creative Commons Atribuição (CC BY): você pode copiar, compartilhar, adaptar e reutilizar este conteúdo, inclusive para fins comerciais, desde que cite o statistics.wiki e indique as alterações que fizer. As fontes listadas acima podem ter suas próprias condições de licença.