
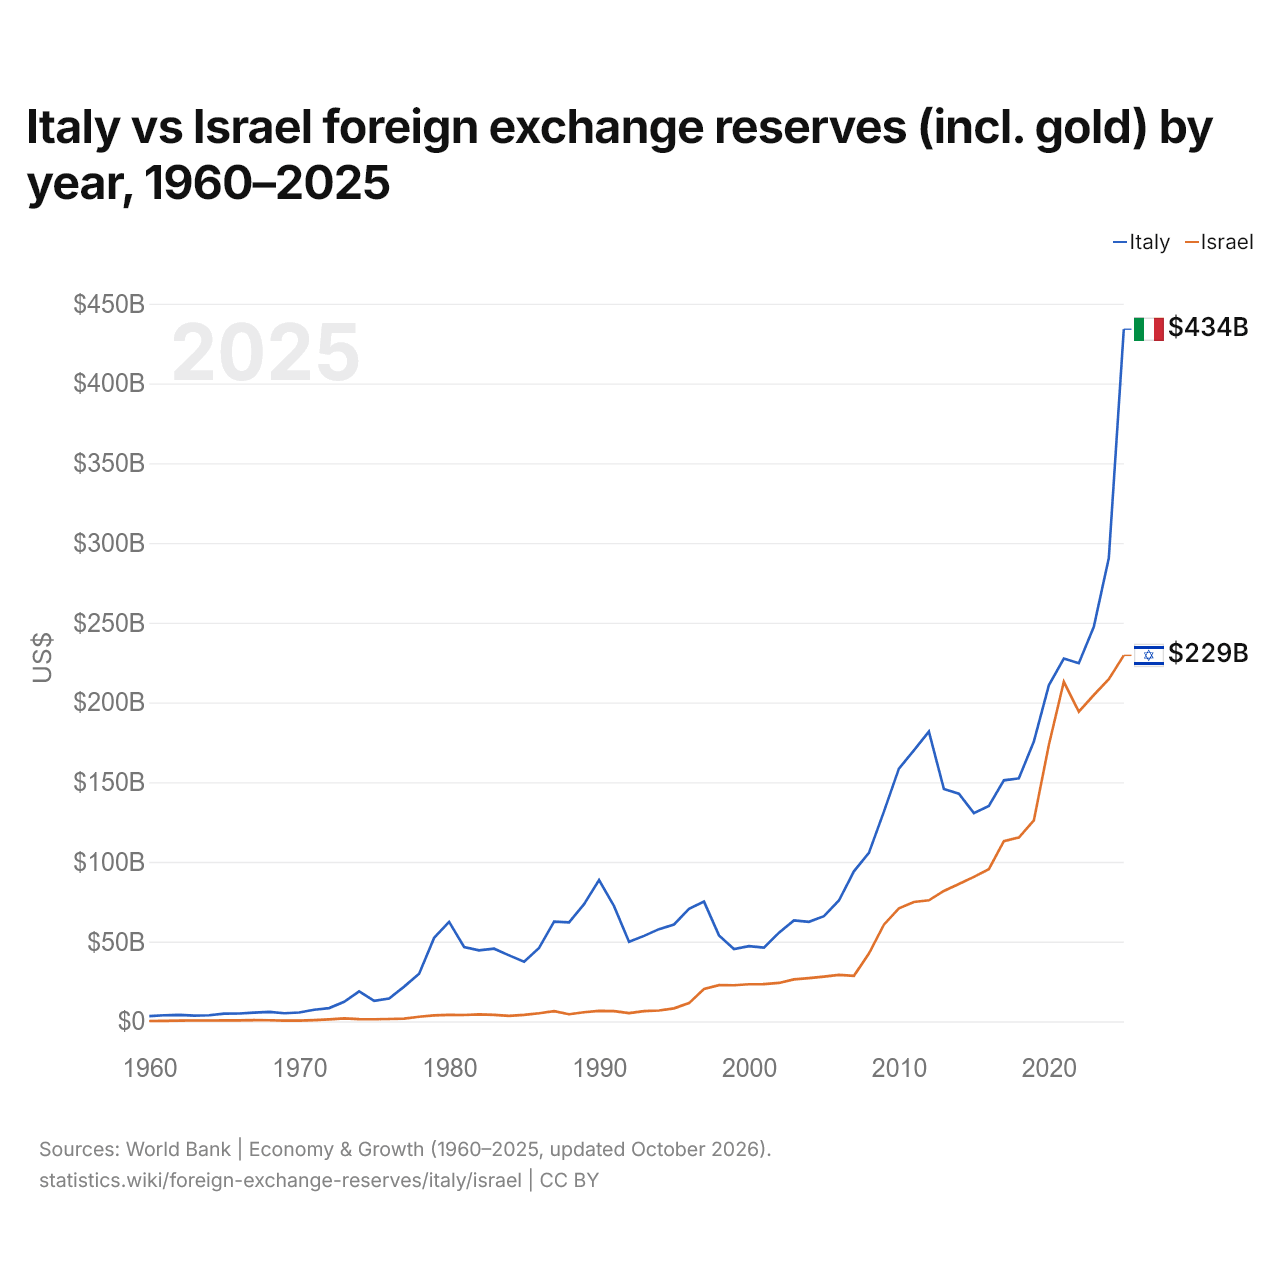
Itália vs Israel: reservas internacionais (incluindo ouro) por ano, 1960–2025
1x
| Ano | US$ | |
|---|---|---|
 Itália |
 Israel |
|
| 2025 | US$ 434.014.519.755 | US$ 229.486.904.239 |
| 2024 | US$ 290.547.420.426 | US$ 214.543.676.670 |
| 2023 | US$ 247.396.414.254 | US$ 204.660.857.567 |
| 2022 | US$ 224.580.577.612 | US$ 194.231.433.878 |
| 2021 | US$ 227.478.327.159 | US$ 212.933.655.186 |
| 2020 | US$ 210.687.330.553 | US$ 173.292.120.893 |
| 2019 | US$ 175.397.954.131 | US$ 126.007.828.810 |
| 2018 | US$ 152.361.936.422 | US$ 115.265.900.521 |
| 2017 | US$ 151.120.440.050 | US$ 113.009.532.488 |
| 2016 | US$ 135.133.283.787 | US$ 95.446.290.282 |
| 2015 | US$ 130.592.432.980 | US$ 90.575.018.408 |
| 2014 | US$ 142.756.493.255 | US$ 86.101.256.622 |
| 2013 | US$ 145.724.509.189 | US$ 81.785.518.233 |
| 2012 | US$ 181.670.318.701 | US$ 75.907.618.701 |
| 2011 | US$ 169.872.360.985 | US$ 74.874.110.293 |
| 2010 | US$ 158.478.306.213 | US$ 70.907.310.771 |
| 2009 | US$ 131.496.916.616 | US$ 60.611.355.181 |
| 2008 | US$ 105.649.105.828 | US$ 42.513.241.647 |
| 2007 | US$ 94.108.647.219 | US$ 28.518.505.747 |
| 2006 | US$ 75.773.325.816 | US$ 29.153.237.864 |
| 2005 | US$ 65.954.006.492 | US$ 28.059.414.574 |
| 2004 | US$ 62.386.140.318 | US$ 27.094.382.253 |
| 2003 | US$ 63.263.645.221 | US$ 26.315.098.306 |
| 2002 | US$ 55.621.728.399 | US$ 24.082.878.018 |
| 2001 | US$ 46.215.583.156 | US$ 23.378.584.659 |
| 2000 | US$ 47.201.146.788 | US$ 23.281.206.068 |
| 1999 | US$ 45.301.890.068 | US$ 22.604.867.902 |
| 1998 | US$ 53.879.698.134 | US$ 22.674.295.629 |
| 1997 | US$ 75.086.486.575 | US$ 20.334.584.790 |
| 1996 | US$ 70.566.438.038 | US$ 11.417.780.235 |
| 1995 | US$ 60.690.107.044 | US$ 8.122.625.601 |
| 1994 | US$ 57.817.130.022 | US$ 6.795.646.821 |
| 1993 | US$ 53.589.806.324 | US$ 6.386.155.658 |
| 1992 | US$ 49.861.589.541 | US$ 5.130.401.751 |
| 1991 | US$ 72.254.305.372 | US$ 6.427.966.121 |
| 1990 | US$ 88.595.441.116 | US$ 6.598.156.852 |
| 1989 | US$ 73.454.774.682 | US$ 5.684.035.275 |
| 1988 | US$ 62.067.048.706 | US$ 4.433.201.785 |
| 1987 | US$ 62.488.960.743 | US$ 6.368.457.379 |
| 1986 | US$ 46.048.953.034 | US$ 5.057.145.300 |
| 1985 | US$ 37.396.565.946 | US$ 4.012.724.905 |
| 1984 | US$ 41.349.282.776 | US$ 3.373.868.527 |
| 1983 | US$ 45.540.036.598 | US$ 4.038.410.758 |
| 1982 | US$ 44.552.893.204 | US$ 4.334.575.278 |
| 1981 | US$ 46.635.435.135 | US$ 3.970.880.954 |
| 1980 | US$ 62.427.835.828 | US$ 4.055.275.456 |
| 1979 | US$ 52.353.996.729 | US$ 3.693.704.330 |
| 1978 | US$ 29.895.032.078 | US$ 2.889.778.656 |
| 1977 | US$ 21.780.300.210 | US$ 1.713.580.567 |
| 1976 | US$ 14.337.537.091 | US$ 1.476.979.093 |
| 1975 | US$ 12.874.206.632 | US$ 1.291.503.394 |
| 1974 | US$ 18.789.255.457 | US$ 1.358.324.375 |
| 1973 | US$ 12.211.762.050 | US$ 1.891.389.447 |
| 1972 | US$ 8.300.403.742 | US$ 1.253.027.076 |
| 1971 | US$ 7.283.733.925 | US$ 743.867.526 |
| 1970 | US$ 5.547.425.490 | US$ 451.538.800 |
| 1969 | US$ 5.061.676.400 | US$ 412.671.200 |
| 1968 | US$ 5.918.045.600 | US$ 672.002.300 |
| 1967 | US$ 5.476.253.200 | US$ 714.857.200 |
| 1966 | US$ 4.923.709.110 | US$ 621.344.090 |
| 1965 | US$ 4.808.141.120 | US$ 643.181.280 |
| 1964 | US$ 3.831.167.440 | US$ 545.175.920 |
| 1963 | US$ 3.624.125.520 | US$ 515.211.720 |
| 1962 | US$ 4.072.606.720 | US$ 419.626.970 |
| 1961 | US$ 3.809.235.500 | US$ 279.512.900 |
| 1960 | US$ 3.288.591.200 | US$ 213.156.800 |
Em 2025, as reservas internacionais da Itália foram de US$ 434 bilhões e as de Israel, de US$ 229 bilhões: as da Itália foram 1,9 vezes maiores. Em 1960, as reservas da Itália foram 15 vezes maiores: US$ 3,29 bilhões da Itália e US$ 213 milhões de Israel.
As reservas internacionais da Itália têm sido maiores que as de Israel todos os anos desde 1960.
Itália vs Israel: reservas, incluindo ouro, e meses de importações cobertos
|
Itália
|
Israel
|
|
|---|---|---|
| Reservas, incluindo ouro | US$ 434 bi | US$ 229 bi |
| Meses de importações | 6,7 | 17,7 |
| Posição mundial | 10/168 | 18/168 |
| Diferença das reservas | 1,9× | 0,53× |
Comparar as reservas internacionais de 2 países quaisquer
Fontes:
- Banco Mundial | Economy & Growth (1960–2025, atualizado em outubro de 2026)
Creative Commons Atribuição (CC BY): você pode copiar, compartilhar, adaptar e reutilizar este conteúdo, inclusive para fins comerciais, desde que cite o statistics.wiki e indique as alterações que fizer. As fontes listadas acima podem ter suas próprias condições de licença.