
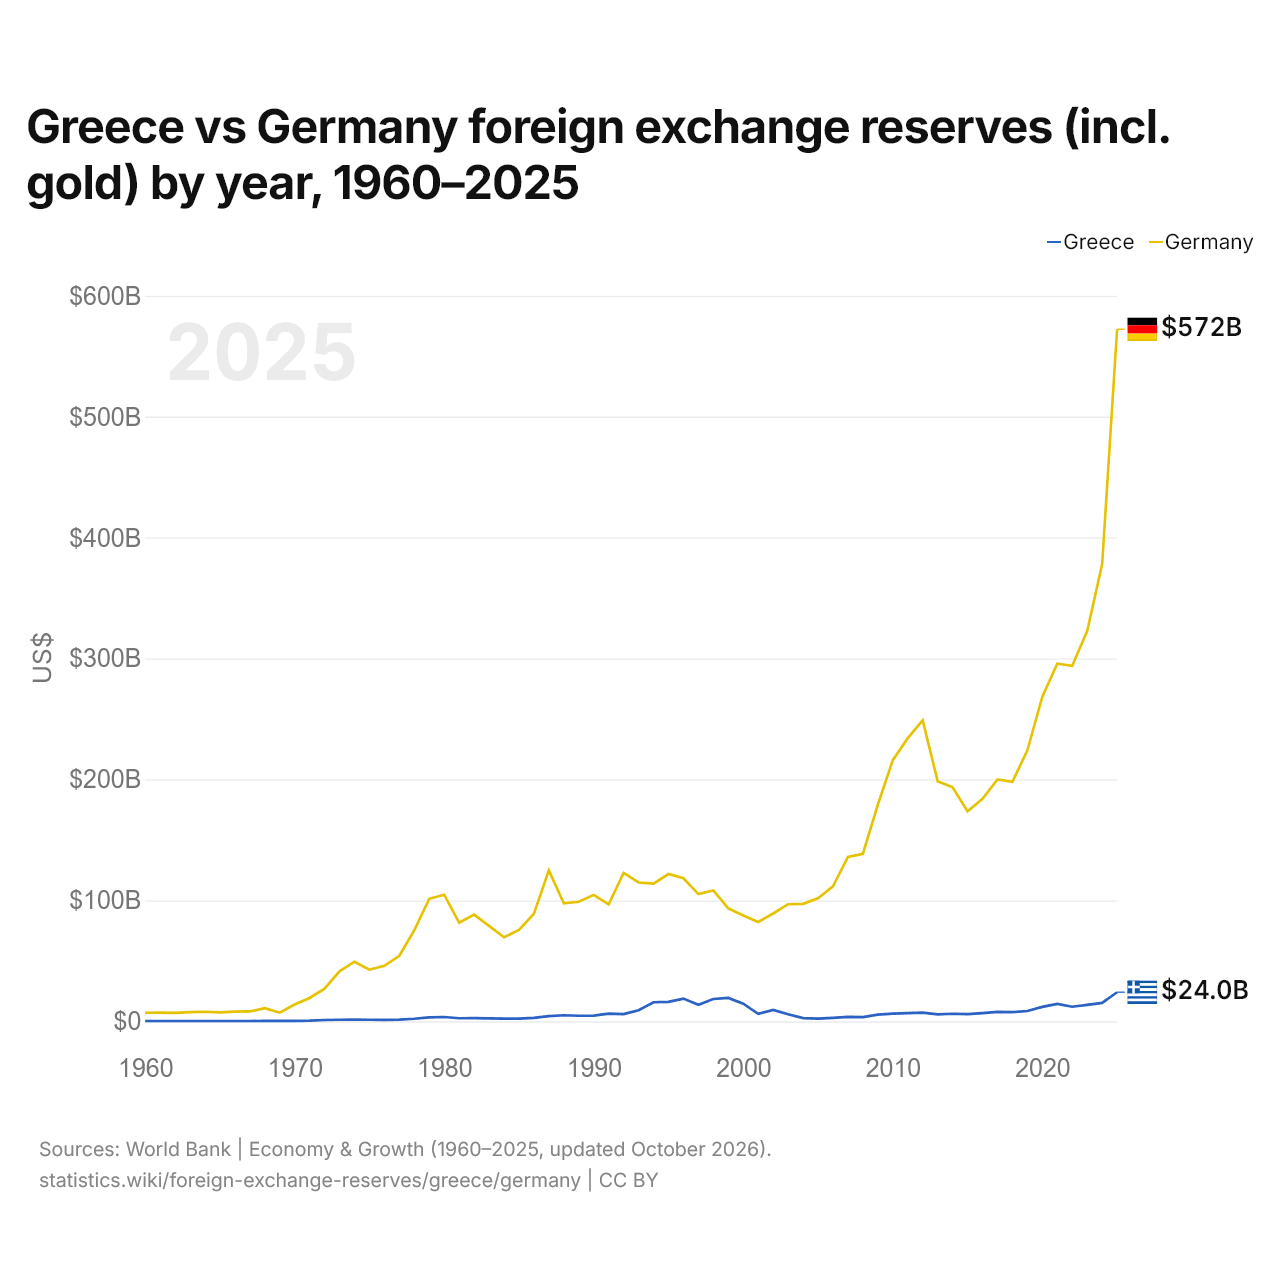
Grécia vs Alemanha: reservas internacionais (incluindo ouro) por ano, 1960–2025
1x
| Ano | US$ | |
|---|---|---|
 Grécia |
 Alemanha |
|
| 2025 | US$ 24.047.515.202 | US$ 572.201.958.133 |
| 2024 | US$ 15.221.750.195 | US$ 377.935.141.356 |
| 2023 | US$ 13.608.620.629 | US$ 322.699.586.275 |
| 2022 | US$ 12.061.425.398 | US$ 293.913.690.187 |
| 2021 | US$ 14.447.242.598 | US$ 295.736.219.414 |
| 2020 | US$ 11.931.180.005 | US$ 268.408.603.349 |
| 2019 | US$ 8.507.452.887 | US$ 224.027.961.016 |
| 2018 | US$ 7.578.500.699 | US$ 198.027.061.675 |
| 2017 | US$ 7.803.722.132 | US$ 199.983.070.124 |
| 2016 | US$ 6.851.247.713 | US$ 184.031.339.953 |
| 2015 | US$ 6.027.606.781 | US$ 173.730.930.555 |
| 2014 | US$ 6.236.284.819 | US$ 193.484.758.848 |
| 2013 | US$ 5.763.071.364 | US$ 198.535.165.664 |
| 2012 | US$ 7.255.024.355 | US$ 248.856.490.286 |
| 2011 | US$ 6.743.416.891 | US$ 234.104.084.887 |
| 2010 | US$ 6.352.405.963 | US$ 215.977.935.890 |
| 2009 | US$ 5.486.122.598 | US$ 179.040.277.107 |
| 2008 | US$ 3.489.670.238 | US$ 138.564.426.162 |
| 2007 | US$ 3.647.605.325 | US$ 135.932.292.207 |
| 2006 | US$ 2.849.953.559 | US$ 111.637.059.518 |
| 2005 | US$ 2.287.009.893 | US$ 101.675.919.832 |
| 2004 | US$ 2.707.782.609 | US$ 97.169.968.441 |
| 2003 | US$ 5.801.377.075 | US$ 96.835.206.408 |
| 2002 | US$ 9.431.530.975 | US$ 89.142.540.697 |
| 2001 | US$ 6.244.166.654 | US$ 82.131.887.554 |
| 2000 | US$ 14.594.006.579 | US$ 87.496.869.035 |
| 1999 | US$ 19.352.094.678 | US$ 93.407.192.492 |
| 1998 | US$ 18.501.070.728 | US$ 108.265.125.242 |
| 1997 | US$ 13.652.307.051 | US$ 105.207.935.385 |
| 1996 | US$ 18.782.300.412 | US$ 118.323.129.017 |
| 1995 | US$ 16.118.557.930 | US$ 121.816.082.183 |
| 1994 | US$ 15.809.339.689 | US$ 113.840.942.069 |
| 1993 | US$ 9.135.322.990 | US$ 114.821.960.533 |
| 1992 | US$ 5.937.644.103 | US$ 122.685.815.300 |
| 1991 | US$ 6.400.005.237 | US$ 96.657.198.482 |
| 1990 | US$ 4.721.071.254 | US$ 104.547.296.416 |
| 1989 | US$ 4.584.865.250 | US$ 98.876.658.479 |
| 1988 | US$ 5.012.214.145 | US$ 97.575.978.902 |
| 1987 | US$ 4.299.295.461 | US$ 124.833.918.206 |
| 1986 | US$ 2.811.792.217 | US$ 88.940.673.108 |
| 1985 | US$ 2.216.191.387 | US$ 75.504.358.025 |
| 1984 | US$ 2.220.066.694 | US$ 69.485.148.466 |
| 1983 | US$ 2.380.722.492 | US$ 78.986.153.756 |
| 1982 | US$ 2.630.216.481 | US$ 88.250.228.616 |
| 1981 | US$ 2.553.564.856 | US$ 81.553.651.369 |
| 1980 | US$ 3.606.607.178 | US$ 104.701.722.862 |
| 1979 | US$ 3.292.536.814 | US$ 101.318.444.091 |
| 1978 | US$ 2.157.055.983 | US$ 75.286.223.392 |
| 1977 | US$ 1.476.777.090 | US$ 54.220.834.450 |
| 1976 | US$ 1.268.118.821 | US$ 45.867.199.927 |
| 1975 | US$ 1.291.435.722 | US$ 42.710.976.245 |
| 1974 | US$ 1.454.967.385 | US$ 49.293.767.750 |
| 1973 | US$ 1.291.978.636 | US$ 41.407.633.837 |
| 1972 | US$ 1.125.644.544 | US$ 26.942.103.304 |
| 1971 | US$ 534.814.271 | US$ 19.312.523.395 |
| 1970 | US$ 318.014.730 | US$ 13.878.868.480 |
| 1969 | US$ 317.766.800 | US$ 7.152.711.600 |
| 1968 | US$ 349.516.700 | US$ 10.843.279.100 |
| 1967 | US$ 286.873.600 | US$ 8.176.362.000 |
| 1966 | US$ 273.284.990 | US$ 8.052.102.610 |
| 1965 | US$ 250.520.560 | US$ 7.445.164.400 |
| 1964 | US$ 281.585.440 | US$ 7.895.954.160 |
| 1963 | US$ 292.161.880 | US$ 7.659.475.440 |
| 1962 | US$ 286.669.630 | US$ 6.964.883.190 |
| 1961 | US$ 267.482.900 | US$ 7.180.500.800 |
| 1960 | US$ 242.101.200 | US$ 7.083.840.800 |
Em 2025, as reservas internacionais da Grécia foram de US$ 24 bilhões e as da Alemanha, de US$ 572 bilhões: as da Alemanha foram 24 vezes maiores. Em 1960, as reservas da Alemanha foram 29 vezes maiores: US$ 242 milhões da Grécia e US$ 7,08 bilhões da Alemanha.
As reservas internacionais da Alemanha têm sido maiores que as da Grécia todos os anos desde 1960.
Grécia vs Alemanha: reservas, incluindo ouro, e meses de importações cobertos
|
Grécia
|
Alemanha
|
|
|---|---|---|
| Reservas, incluindo ouro | US$ 24,0 bi | US$ 572 bi |
| Meses de importações | 2,3 | 3,6 |
| Posição mundial | 63/168 | 7/168 |
| Diferença das reservas | 0,042× | 24× |
Comparar as reservas internacionais de 2 países quaisquer
Fontes:
- Banco Mundial | Economy & Growth (1960–2025, atualizado em outubro de 2026)
Creative Commons Atribuição (CC BY): você pode copiar, compartilhar, adaptar e reutilizar este conteúdo, inclusive para fins comerciais, desde que cite o statistics.wiki e indique as alterações que fizer. As fontes listadas acima podem ter suas próprias condições de licença.