
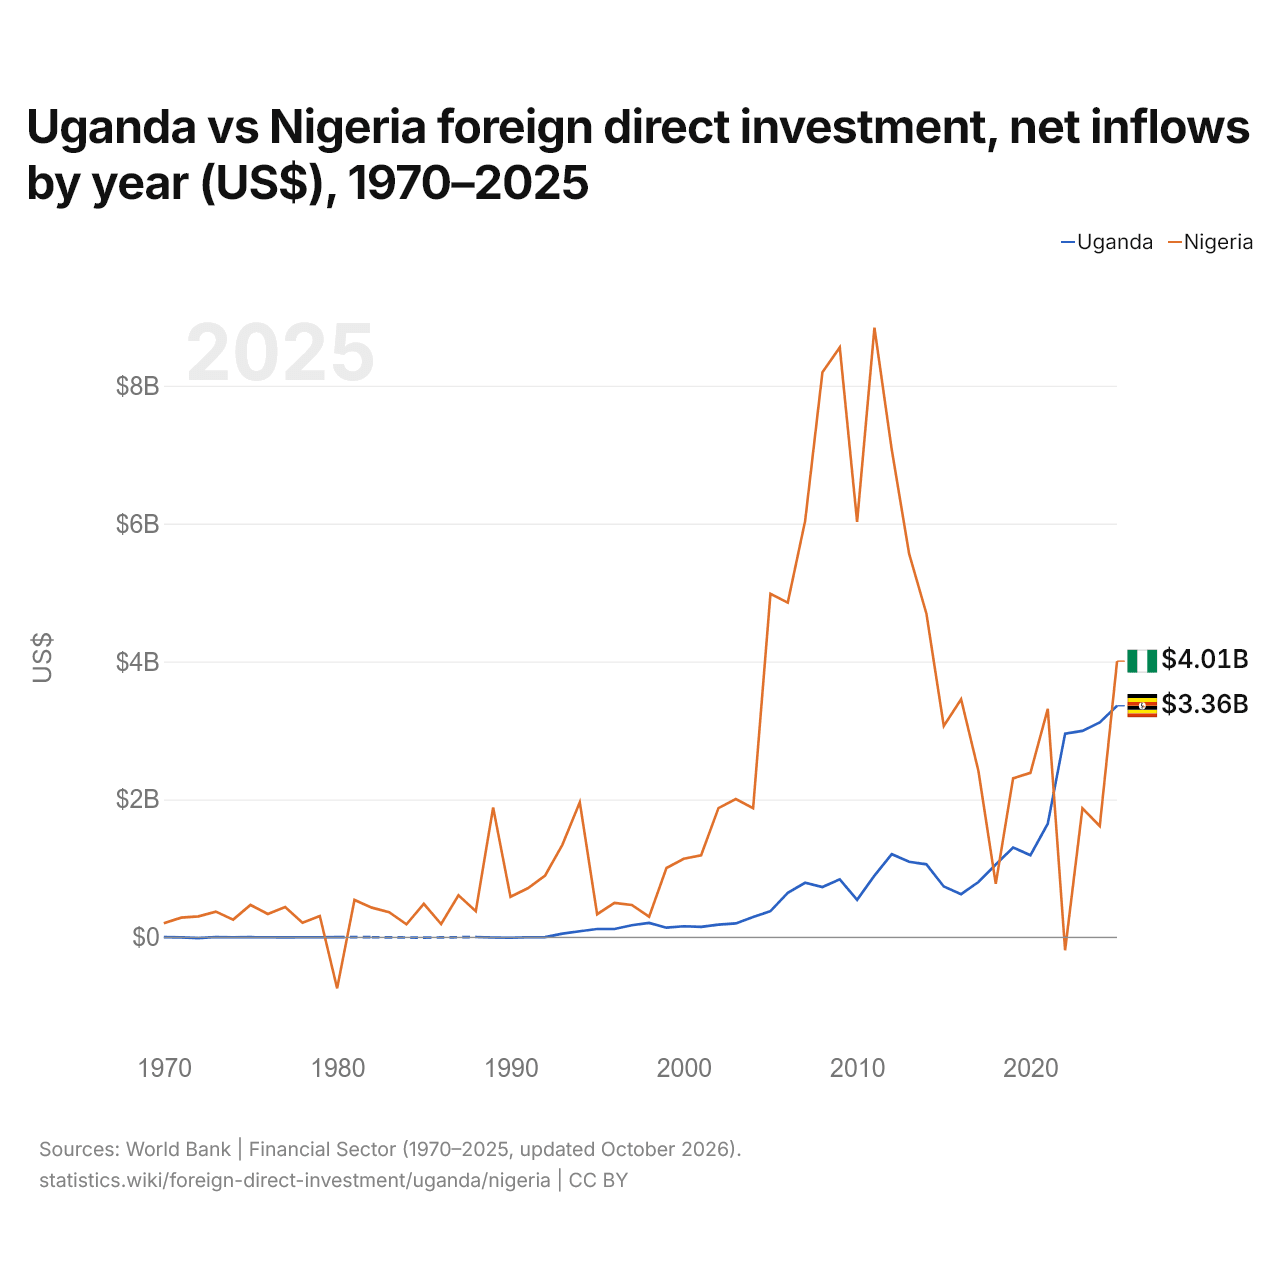
Uganda vs Nigéria: investimento estrangeiro direto, entradas líquidas por ano (US$), 1970–2025
| Ano | US$ | |
|---|---|---|
 Uganda |
 Nigéria |
|
| 2025 | US$ 3.358.037.364 | US$ 4.005.360.387 |
| 2024 | US$ 3.115.669.894 | US$ 1.614.032.957 |
| 2023 | US$ 2.993.518.989 | US$ 1.872.520.530 |
| 2022 | US$ 2.952.941.688 | US$ −186.792.429 |
| 2021 | US$ 1.648.240.263 | US$ 3.313.210.000 |
| 2020 | US$ 1.191.485.424 | US$ 2.385.277.666 |
| 2019 | US$ 1.303.005.005 | US$ 2.305.099.812 |
| 2018 | US$ 1.055.353.353 | US$ 775.247.400 |
| 2017 | US$ 802.704.141 | US$ 2.412.974.916 |
| 2016 | US$ 625.704.362 | US$ 3.453.258.408 |
| 2015 | US$ 737.652.140 | US$ 3.064.168.904 |
| 2014 | US$ 1.058.564.540 | US$ 4.693.828.632 |
| 2013 | US$ 1.096.000.000 | US$ 5.562.857.987 |
| 2012 | US$ 1.205.388.488 | US$ 7.069.908.428 |
| 2011 | US$ 894.293.858 | US$ 8.841.062.051 |
| 2010 | US$ 543.872.727 | US$ 6.026.253.091 |
| 2009 | US$ 841.570.803 | US$ 8.555.990.007 |
| 2008 | US$ 728.860.901 | US$ 8.194.071.895 |
| 2007 | US$ 792.305.781 | US$ 6.036.021.405 |
| 2006 | US$ 644.262.500 | US$ 4.854.353.979 |
| 2005 | US$ 379.808.341 | US$ 4.982.533.930 |
| 2004 | US$ 295.416.480 | US$ 1.874.060.887 |
| 2003 | US$ 202.192.594 | US$ 2.005.353.563 |
| 2002 | US$ 184.648.059 | US$ 1.874.070.753 |
| 2001 | US$ 151.496.151 | US$ 1.190.618.644 |
| 2000 | US$ 160.700.000 | US$ 1.140.167.556 |
| 1999 | US$ 140.200.000 | US$ 1.004.915.631 |
| 1998 | US$ 210.000.000 | US$ 299.566.658 |
| 1997 | US$ 175.000.000 | US$ 469.577.020 |
| 1996 | US$ 121.000.000 | US$ 499.276.809 |
| 1995 | US$ 121.200.000 | US$ 335.842.165 |
| 1994 | US$ 88.200.000 | US$ 1.959.219.858 |
| 1993 | US$ 54.600.000 | US$ 1.345.368.587 |
| 1992 | US$ 3.000.000 | US$ 896.641.282 |
| 1991 | US$ 1.000.000 | US$ 712.373.362 |
| 1990 | US$ −5.910.000 | US$ 587.882.971 |
| 1989 | US$ −1.760.000 | US$ 1.884.249.739 |
| 1988 | US$ 4.700.000 | US$ 378.667.098 |
| 1987 | - | US$ 610.552.091 |
| 1986 | - | US$ 193.214.908 |
| 1985 | US$ −4.000.000 | US$ 485.581.321 |
| 1984 | - | US$ 189.164.785 |
| 1983 | - | US$ 364.434.580 |
| 1982 | US$ 2.020.000 | US$ 430.611.256 |
| 1981 | - | US$ 542.327.289 |
| 1980 | US$ 4.000.000 | US$ −738.870.004 |
| 1979 | US$ 2.000.000 | US$ 309.598.869 |
| 1978 | US$ 1.970.000 | US$ 210.933.271 |
| 1977 | US$ 800.000 | US$ 440.514.242 |
| 1976 | US$ 2.050.000 | US$ 339.000.000 |
| 1975 | US$ 2.100.000 | US$ 470.120.000 |
| 1974 | US$ 1.700.000 | US$ 257.000.000 |
| 1973 | US$ 5.200.000 | US$ 373.000.000 |
| 1972 | US$ −11.900.000 | US$ 305.000.000 |
| 1971 | US$ −1.200.000 | US$ 286.000.000 |
| 1970 | US$ 4.200.000 | US$ 205.000.000 |
Em 2025, as entradas líquidas de investimento estrangeiro direto foram de US$ 3,36 bilhões em Uganda e de US$ 4,01 bilhões na Nigéria: 19% a mais na Nigéria. Em 1970, foram de US$ 4,2 milhões em Uganda e de US$ 205 milhões na Nigéria.
As entradas líquidas de investimento estrangeiro direto em Uganda foram maiores que na Nigéria em 5 dos 51 anos de 1970 a 2025 que os dois países informaram, e menores em 46.
Uganda vs Nigéria: entradas e saídas mais recentes de investimento estrangeiro
|
Uganda
|
Nigéria
|
|
|---|---|---|
| Entradas líquidas | +US$ 3,36 bi | +US$ 4,01 bi |
| Entradas líquidas, % do PIB | +5,4% | +1,4% |
| Saídas líquidas | +US$ 417 mil | +US$ 1,19 bi |
| Entradas líquidas, total 2016–2025 | +US$ 19,0 bi | +US$ 22,0 bi |
| Posição mundial | 55/192 | 51/192 |
Comparar o investimento estrangeiro direto de 2 países quaisquer
Fontes:
- Banco Mundial | Financial Sector (1970–2025, atualizado em outubro de 2026)
Creative Commons Atribuição (CC BY): você pode copiar, compartilhar, adaptar e reutilizar este conteúdo, inclusive para fins comerciais, desde que cite o statistics.wiki e indique as alterações que fizer. As fontes listadas acima podem ter suas próprias condições de licença.