
Uganda vs Burundi: investimento estrangeiro direto, entradas líquidas por ano (US$), 1970–2025
| Ano | US$ | |
|---|---|---|
 Uganda |
 Burundi |
|
| 2025 | US$ 3.358.037.364 | US$ 35.116.090 |
| 2024 | US$ 3.115.669.894 | US$ 33.322.928 |
| 2023 | US$ 2.993.518.989 | US$ 33.999.318 |
| 2022 | US$ 2.952.941.688 | US$ 25.249.489 |
| 2021 | US$ 1.648.240.263 | US$ 22.351.623 |
| 2020 | US$ 1.191.485.424 | US$ 21.196.555 |
| 2019 | US$ 1.303.005.005 | US$ 30.280.866 |
| 2018 | US$ 1.055.353.353 | US$ 6.663.762 |
| 2017 | US$ 802.704.141 | US$ 65.319.815 |
| 2016 | US$ 625.704.362 | US$ 55.104 |
| 2015 | US$ 737.652.140 | US$ 7.439.565 |
| 2014 | US$ 1.058.564.540 | US$ 91.720.479 |
| 2013 | US$ 1.096.000.000 | US$ 116.727.137 |
| 2012 | US$ 1.205.388.488 | US$ 604.920 |
| 2011 | US$ 894.293.858 | US$ 3.354.999 |
| 2010 | US$ 543.872.727 | US$ 780.582 |
| 2009 | US$ 841.570.803 | US$ 348.405 |
| 2008 | US$ 728.860.901 | US$ 3.833.208 |
| 2007 | US$ 792.305.781 | US$ 500.245 |
| 2006 | US$ 644.262.500 | US$ 31.594 |
| 2005 | US$ 379.808.341 | US$ 584.702 |
| 2004 | US$ 295.416.480 | US$ 44.691 |
| 2003 | US$ 202.192.594 | - |
| 2002 | US$ 184.648.059 | - |
| 2001 | US$ 151.496.151 | US$ −11.441 |
| 2000 | US$ 160.700.000 | US$ 11.683.246 |
| 1999 | US$ 140.200.000 | US$ −475.191 |
| 1998 | US$ 210.000.000 | - |
| 1997 | US$ 175.000.000 | - |
| 1996 | US$ 121.000.000 | - |
| 1995 | US$ 121.200.000 | US$ 1.981.922 |
| 1994 | US$ 88.200.000 | US$ 3.958 |
| 1993 | US$ 54.600.000 | US$ 473.680 |
| 1992 | US$ 3.000.000 | US$ 600.088 |
| 1991 | US$ 1.000.000 | US$ 892.500 |
| 1990 | US$ −5.910.000 | US$ 1.255.435 |
| 1989 | US$ −1.760.000 | US$ 567.227 |
| 1988 | US$ 4.700.000 | US$ 1.196.624 |
| 1987 | - | US$ 1.367.714 |
| 1986 | - | US$ 1.524.029 |
| 1985 | US$ −4.000.000 | US$ 538.567 |
| 1984 | - | US$ 1.190.000 |
| 1983 | - | US$ 3.040.000 |
| 1982 | US$ 2.020.000 | US$ 900.000 |
| 1981 | - | US$ 11.080.000 |
| 1980 | US$ 4.000.000 | US$ 4.600.000 |
| 1979 | US$ 2.000.000 | US$ −300.000 |
| 1978 | US$ 1.970.000 | US$ 890.000 |
| 1977 | US$ 800.000 | US$ −250.000 |
| 1976 | US$ 2.050.000 | US$ 80.000 |
| 1975 | US$ 2.100.000 | US$ 320.000 |
| 1974 | US$ 1.700.000 | US$ 220.000 |
| 1973 | US$ 5.200.000 | US$ 440.000 |
| 1972 | US$ −11.900.000 | US$ 410.000 |
| 1971 | US$ −1.200.000 | - |
| 1970 | US$ 4.200.000 | US$ 100.000 |
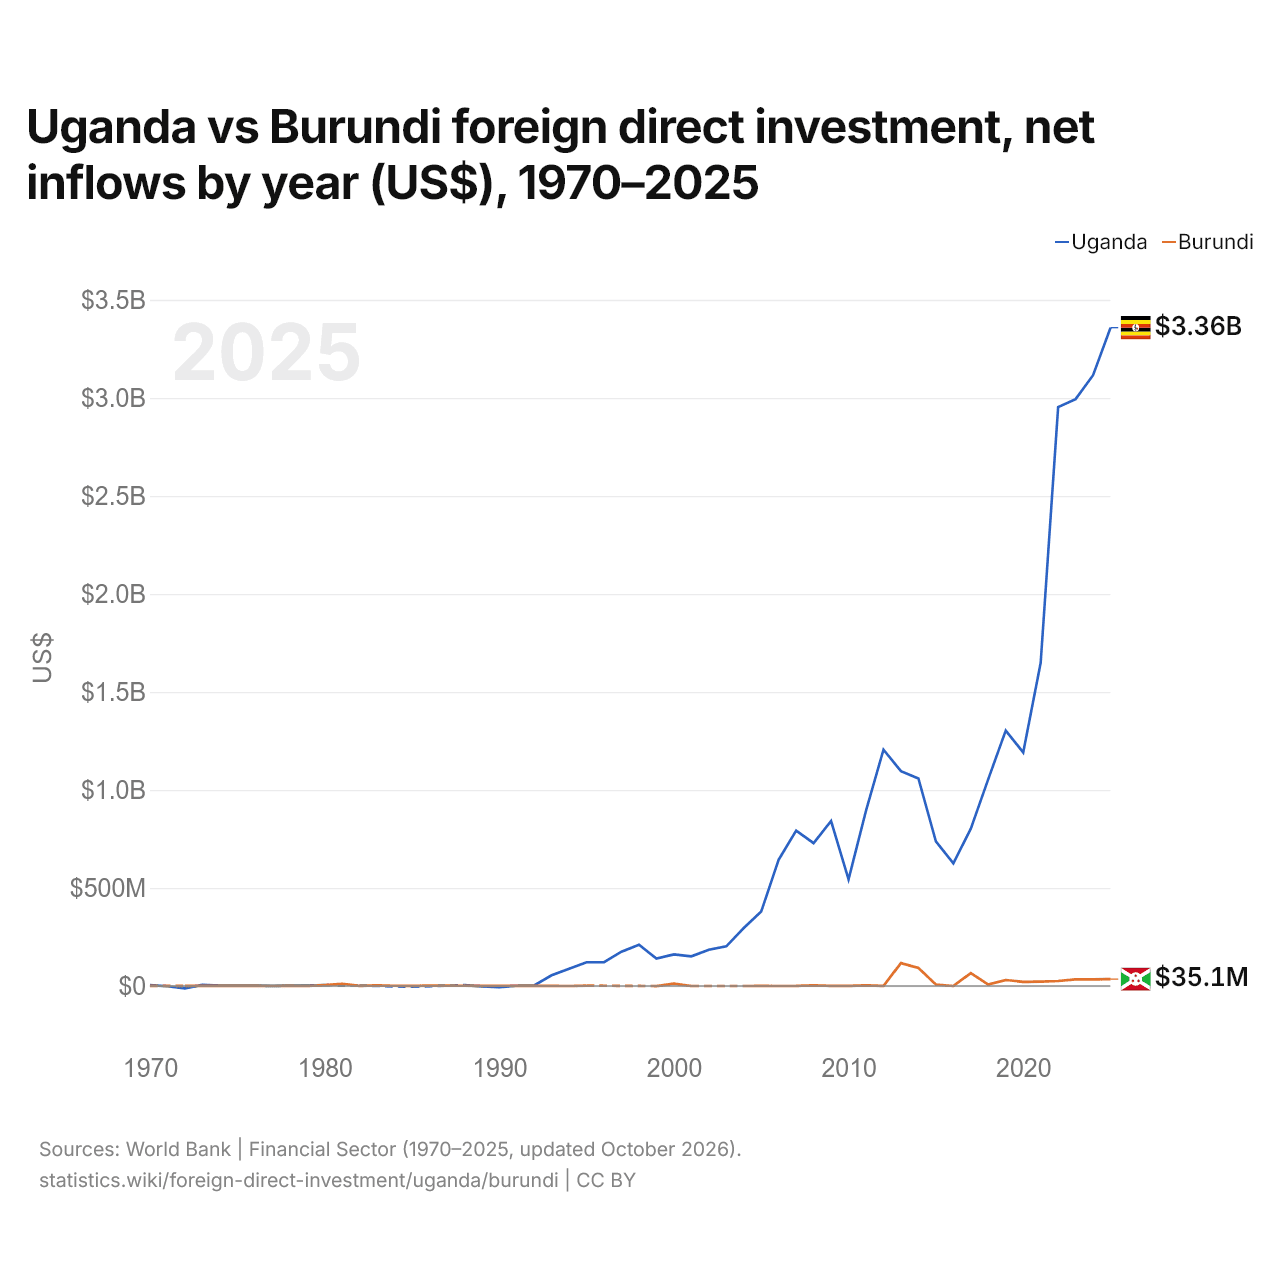
Em 2025, as entradas líquidas de investimento estrangeiro direto foram de US$ 3,36 bilhões em Uganda e de US$ 35,1 milhões no Burundi: 96 vezes mais em Uganda. Em 1970, foram de US$ 4,2 milhões em Uganda e de US$ 100.000 no Burundi.
As entradas líquidas de investimento estrangeiro direto em Uganda foram maiores que no Burundi em 40 dos 45 anos de 1970 a 2025 que os dois países informaram, e menores em 5.
Uganda vs Burundi: entradas e saídas mais recentes de investimento estrangeiro
|
Uganda
|
Burundi
|
|
|---|---|---|
| Entradas líquidas | +US$ 3,36 bi | +US$ 35,1 mi |
| Entradas líquidas, % do PIB | +5,4% | +1,0% |
| Saídas líquidas | +US$ 417 mil | +US$ 3,90 mi |
| Entradas líquidas, total 2016–2025 | +US$ 19,0 bi | +US$ 274 mi |
| Posição mundial | 55/192 | 158/192 |
Comparar o investimento estrangeiro direto de 2 países quaisquer
Fontes:
- Banco Mundial | Financial Sector (1970–2025, atualizado em outubro de 2026)
Creative Commons Atribuição (CC BY): você pode copiar, compartilhar, adaptar e reutilizar este conteúdo, inclusive para fins comerciais, desde que cite o statistics.wiki e indique as alterações que fizer. As fontes listadas acima podem ter suas próprias condições de licença.