
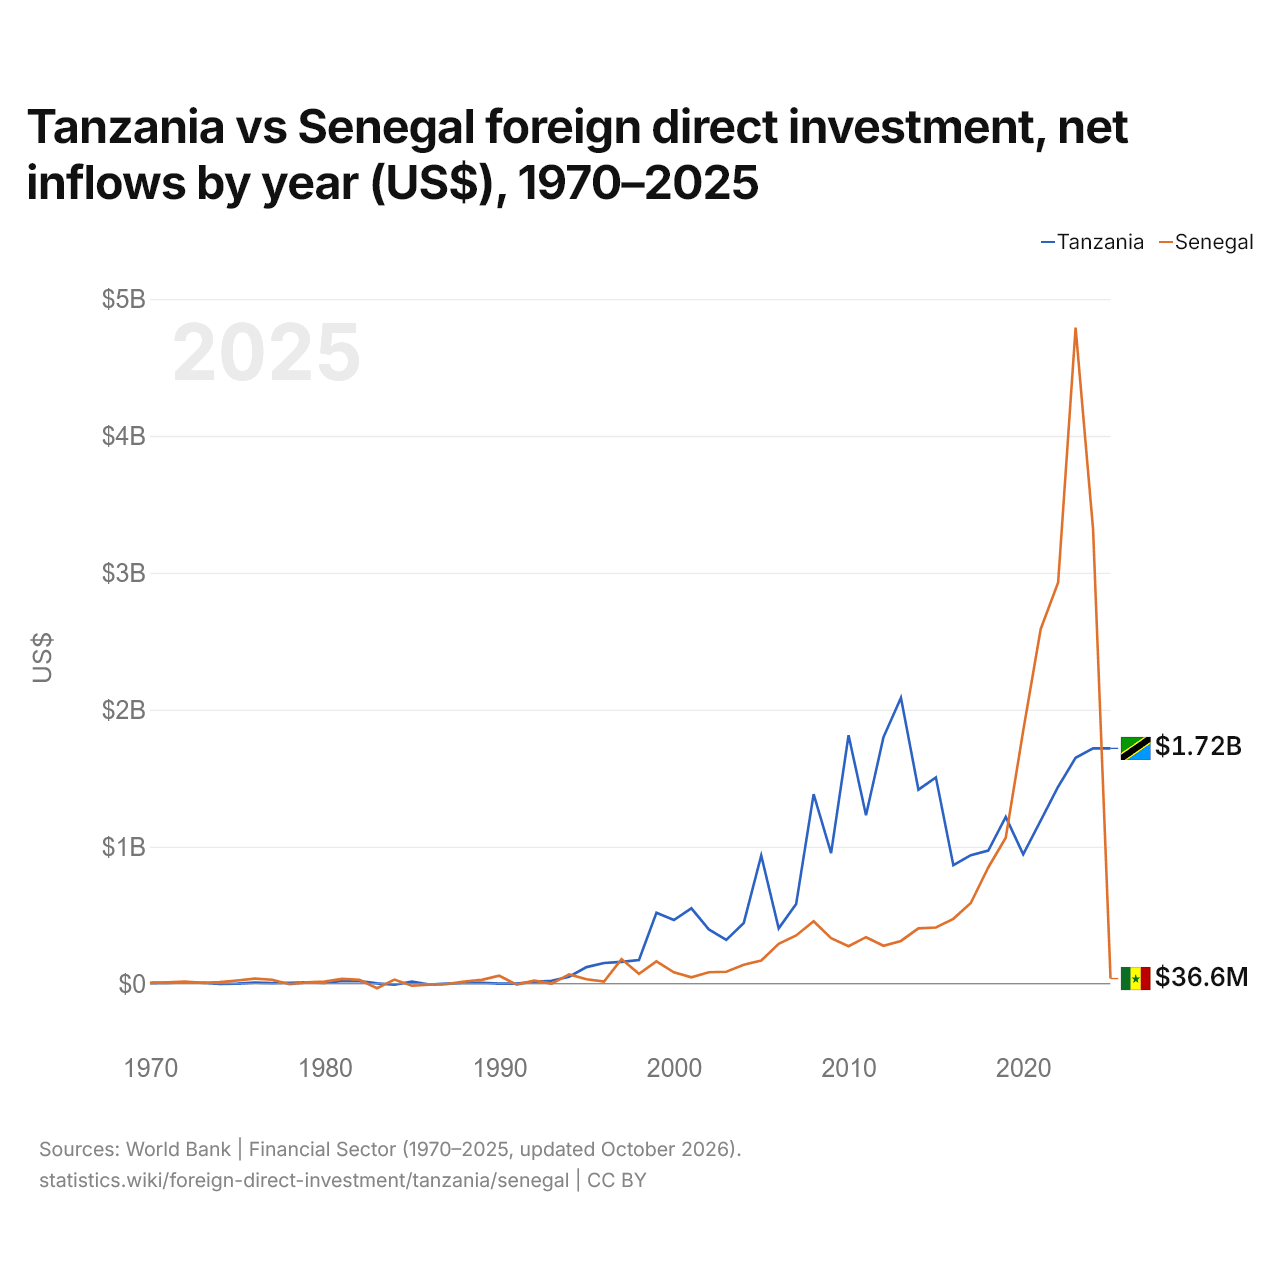
Tanzânia vs Senegal: investimento estrangeiro direto, entradas líquidas por ano (US$), 1970–2025
| Ano | US$ | |
|---|---|---|
 Tanzânia |
 Senegal |
|
| 2025 | US$ 1.717.575.170 | US$ 36.576.601 |
| 2024 | US$ 1.717.575.169 | US$ 3.318.671.430 |
| 2023 | US$ 1.648.913.856 | US$ 4.789.996.739 |
| 2022 | US$ 1.437.575.169 | US$ 2.928.675.555 |
| 2021 | US$ 1.190.507.399 | US$ 2.588.127.208 |
| 2020 | US$ 943.765.262 | US$ 1.845.665.273 |
| 2019 | US$ 1.217.235.252 | US$ 1.065.461.344 |
| 2018 | US$ 971.576.866 | US$ 847.841.575 |
| 2017 | US$ 937.700.000 | US$ 588.292.998 |
| 2016 | US$ 864.040.000 | US$ 472.409.800 |
| 2015 | US$ 1.506.024.896 | US$ 409.166.126 |
| 2014 | US$ 1.416.088.065 | US$ 403.098.056 |
| 2013 | US$ 2.087.261.310 | US$ 311.366.769 |
| 2012 | US$ 1.799.646.137 | US$ 276.159.533 |
| 2011 | US$ 1.229.361.018 | US$ 338.661.996 |
| 2010 | US$ 1.813.200.000 | US$ 272.092.888 |
| 2009 | US$ 952.630.000 | US$ 331.473.910 |
| 2008 | US$ 1.383.260.000 | US$ 455.739.868 |
| 2007 | US$ 581.511.807 | US$ 351.458.732 |
| 2006 | US$ 403.038.991 | US$ 289.840.300 |
| 2005 | US$ 935.520.592 | US$ 167.944.231 |
| 2004 | US$ 442.539.548 | US$ 137.583.477 |
| 2003 | US$ 318.401.299 | US$ 86.499.780 |
| 2002 | US$ 395.567.134 | US$ 82.692.672 |
| 2001 | US$ 549.270.351 | US$ 45.083.430 |
| 2000 | US$ 463.400.859 | US$ 81.643.690 |
| 1999 | US$ 516.700.642 | US$ 161.686.936 |
| 1998 | US$ 172.306.245 | US$ 71.105.812 |
| 1997 | US$ 157.885.064 | US$ 178.810.136 |
| 1996 | US$ 150.066.382 | US$ 13.955.559 |
| 1995 | US$ 119.936.654 | US$ 31.673.945 |
| 1994 | US$ 50.000.895 | US$ 66.876.236 |
| 1993 | US$ 20.457.764 | US$ −812.254 |
| 1992 | US$ 12.169.639 | US$ 21.383.360 |
| 1991 | US$ 10.000 | US$ −7.550.329 |
| 1990 | US$ 10.000 | US$ 56.893.145 |
| 1989 | US$ 5.840.000 | US$ 26.801.811 |
| 1988 | US$ 3.760.000 | US$ 14.940.496 |
| 1987 | US$ −470.000 | US$ −3.959.585 |
| 1986 | US$ −7.490.000 | US$ −8.431.852 |
| 1985 | US$ 14.510.000 | US$ −15.803.662 |
| 1984 | US$ −8.420.000 | US$ 29.087.553 |
| 1983 | US$ 1.520.000 | US$ −34.692.150 |
| 1982 | US$ 17.310.000 | US$ 28.057.896 |
| 1981 | US$ 18.920.000 | US$ 34.372.171 |
| 1980 | US$ 4.580.000 | US$ 14.483.181 |
| 1979 | US$ 8.020.000 | US$ 8.931.860 |
| 1978 | US$ 6.120.000 | US$ −5.007.625 |
| 1977 | US$ 2.940.000 | US$ 27.963.240 |
| 1976 | US$ 6.560.000 | US$ 35.865.170 |
| 1975 | US$ −870.000 | US$ 22.537.141 |
| 1974 | US$ −2.060.000 | US$ 10.261.538 |
| 1973 | US$ 6.030.000 | US$ 4.900.000 |
| 1972 | US$ 7.690.000 | US$ 15.200.000 |
| 1971 | US$ 5.150.000 | US$ 9.800.000 |
| 1970 | US$ 3.070.000 | US$ 5.000.000 |
Em 2025, as entradas líquidas de investimento estrangeiro direto foram de US$ 1,72 bilhão na Tanzânia e de US$ 36,6 milhões no Senegal: 47 vezes mais na Tanzânia. Em 1970, foram de US$ 3,07 milhões na Tanzânia e de US$ 5 milhões no Senegal.
As entradas líquidas de investimento estrangeiro direto na Tanzânia foram maiores que no Senegal em 33 dos 56 anos de 1970 a 2025, e menores em 23. As entradas líquidas na Tanzânia e no Senegal foram negativas (desinvestimento) ao mesmo tempo em 2 desses anos, o mais recente em 1987.
Tanzânia vs Senegal: entradas e saídas mais recentes de investimento estrangeiro
|
Tanzânia
|
Senegal
|
|
|---|---|---|
| Entradas líquidas | +US$ 1,72 bi | +US$ 36,6 mi |
| Entradas líquidas, % do PIB | +1,9% | +0,1% |
| Saídas líquidas | n/d | +US$ 638 mil (2025) |
| Entradas líquidas, total 2016–2025 | +US$ 12,6 bi | +US$ 18,5 bi |
| Posição mundial | 74/192 | 157/192 |
Comparar o investimento estrangeiro direto de 2 países quaisquer
Fontes:
- Banco Mundial | Financial Sector (1970–2025, atualizado em outubro de 2026)
Creative Commons Atribuição (CC BY): você pode copiar, compartilhar, adaptar e reutilizar este conteúdo, inclusive para fins comerciais, desde que cite o statistics.wiki e indique as alterações que fizer. As fontes listadas acima podem ter suas próprias condições de licença.