
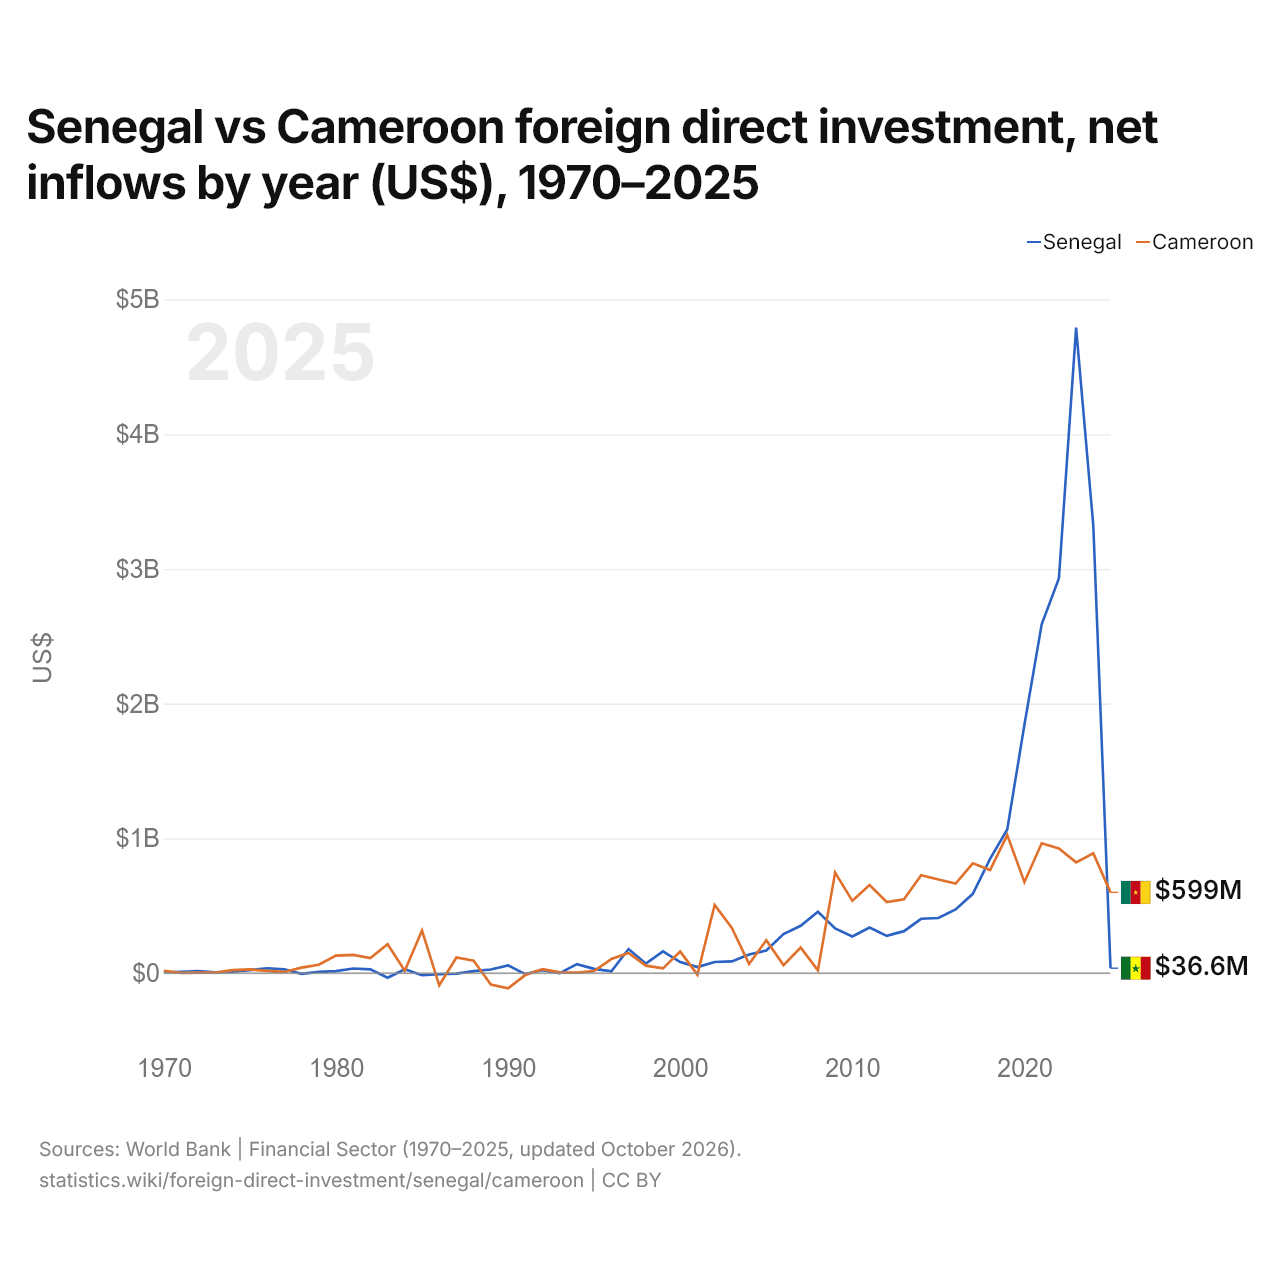
Senegal vs Camarões: investimento estrangeiro direto, entradas líquidas por ano (US$), 1970–2025
| Ano | US$ | |
|---|---|---|
 Senegal |
 Camarões |
|
| 2025 | US$ 36.576.601 | US$ 598.949.781 |
| 2024 | US$ 3.318.671.430 | US$ 888.218.144 |
| 2023 | US$ 4.789.996.739 | US$ 821.546.383 |
| 2022 | US$ 2.928.675.555 | US$ 925.681.549 |
| 2021 | US$ 2.588.127.208 | US$ 963.531.503 |
| 2020 | US$ 1.845.665.273 | US$ 675.186.994 |
| 2019 | US$ 1.065.461.344 | US$ 1.024.779.238 |
| 2018 | US$ 847.841.575 | US$ 765.092.013 |
| 2017 | US$ 588.292.998 | US$ 814.458.941 |
| 2016 | US$ 472.409.800 | US$ 663.893.595 |
| 2015 | US$ 409.166.126 | US$ 694.336.735 |
| 2014 | US$ 403.098.056 | US$ 725.854.541 |
| 2013 | US$ 311.366.769 | US$ 547.404.750 |
| 2012 | US$ 276.159.533 | US$ 527.363.936 |
| 2011 | US$ 338.661.996 | US$ 653.266.627 |
| 2010 | US$ 272.092.888 | US$ 536.265.313 |
| 2009 | US$ 331.473.910 | US$ 746.276.649 |
| 2008 | US$ 455.739.868 | US$ 20.995.514 |
| 2007 | US$ 351.458.732 | US$ 189.581.295 |
| 2006 | US$ 289.840.300 | US$ 59.122.291 |
| 2005 | US$ 167.944.231 | US$ 243.601.637 |
| 2004 | US$ 137.583.477 | US$ 67.984.856 |
| 2003 | US$ 86.499.780 | US$ 334.888.536 |
| 2002 | US$ 82.692.672 | US$ 505.256.043 |
| 2001 | US$ 45.083.430 | US$ −11.668.387 |
| 2000 | US$ 81.643.690 | US$ 159.708.006 |
| 1999 | US$ 161.686.936 | US$ 35.009.802 |
| 1998 | US$ 71.105.812 | US$ 55.231.294 |
| 1997 | US$ 178.810.136 | US$ 149.614.498 |
| 1996 | US$ 13.955.559 | US$ 104.417.058 |
| 1995 | US$ 31.673.945 | US$ 15.105.727 |
| 1994 | US$ 66.876.236 | US$ 3.674.321 |
| 1993 | US$ −812.254 | US$ 5.120.733 |
| 1992 | US$ 21.383.360 | US$ 29.203.776 |
| 1991 | US$ −7.550.329 | US$ −14.498.050 |
| 1990 | US$ 56.893.145 | US$ −112.831.337 |
| 1989 | US$ 26.801.811 | US$ −85.734.447 |
| 1988 | US$ 14.940.496 | US$ 92.362.479 |
| 1987 | US$ −3.959.585 | US$ 115.925.995 |
| 1986 | US$ −8.431.852 | US$ −90.700.158 |
| 1985 | US$ −15.803.662 | US$ 316.229.050 |
| 1984 | US$ 29.087.553 | US$ 17.667.656 |
| 1983 | US$ −34.692.150 | US$ 213.821.208 |
| 1982 | US$ 28.057.896 | US$ 111.440.363 |
| 1981 | US$ 34.372.171 | US$ 135.391.025 |
| 1980 | US$ 14.483.181 | US$ 129.827.990 |
| 1979 | US$ 8.931.860 | US$ 62.099.934 |
| 1978 | US$ −5.007.625 | US$ 40.548.471 |
| 1977 | US$ 27.963.240 | US$ 8.710.529 |
| 1976 | US$ 35.865.170 | US$ 16.400.000 |
| 1975 | US$ 22.537.141 | US$ 27.100.000 |
| 1974 | US$ 10.261.538 | US$ 21.600.000 |
| 1973 | US$ 4.900.000 | US$ 3.100.000 |
| 1972 | US$ 15.200.000 | US$ 3.300.000 |
| 1971 | US$ 9.800.000 | US$ 1.700.000 |
| 1970 | US$ 5.000.000 | US$ 16.000.000 |
Em 2025, as entradas líquidas de investimento estrangeiro direto foram de US$ 36,6 milhões no Senegal e de US$ 599 milhões em Camarões: 16 vezes mais em Camarões. Em 1970, foram de US$ 5 milhões no Senegal e de US$ 16 milhões em Camarões.
As entradas líquidas de investimento estrangeiro direto no Senegal foram maiores que em Camarões em 27 dos 56 anos de 1970 a 2025, e menores em 29. As entradas líquidas no Senegal e em Camarões foram negativas (desinvestimento) ao mesmo tempo em 2 desses anos, o mais recente em 1991.
Senegal vs Camarões: entradas e saídas mais recentes de investimento estrangeiro
|
Senegal
|
Camarões
|
|
|---|---|---|
| Entradas líquidas | +US$ 36,6 mi | +US$ 599 mi |
| Entradas líquidas, % do PIB | +0,1% | +1,0% |
| Saídas líquidas | +US$ 638 mil | +US$ 6,89 mi |
| Entradas líquidas, total 2016–2025 | +US$ 18,5 bi | +US$ 8,14 bi |
| Posição mundial | 157/192 | 112/192 |
Comparar o investimento estrangeiro direto de 2 países quaisquer
Fontes:
- Banco Mundial | Financial Sector (1970–2025, atualizado em outubro de 2026)
Creative Commons Atribuição (CC BY): você pode copiar, compartilhar, adaptar e reutilizar este conteúdo, inclusive para fins comerciais, desde que cite o statistics.wiki e indique as alterações que fizer. As fontes listadas acima podem ter suas próprias condições de licença.