
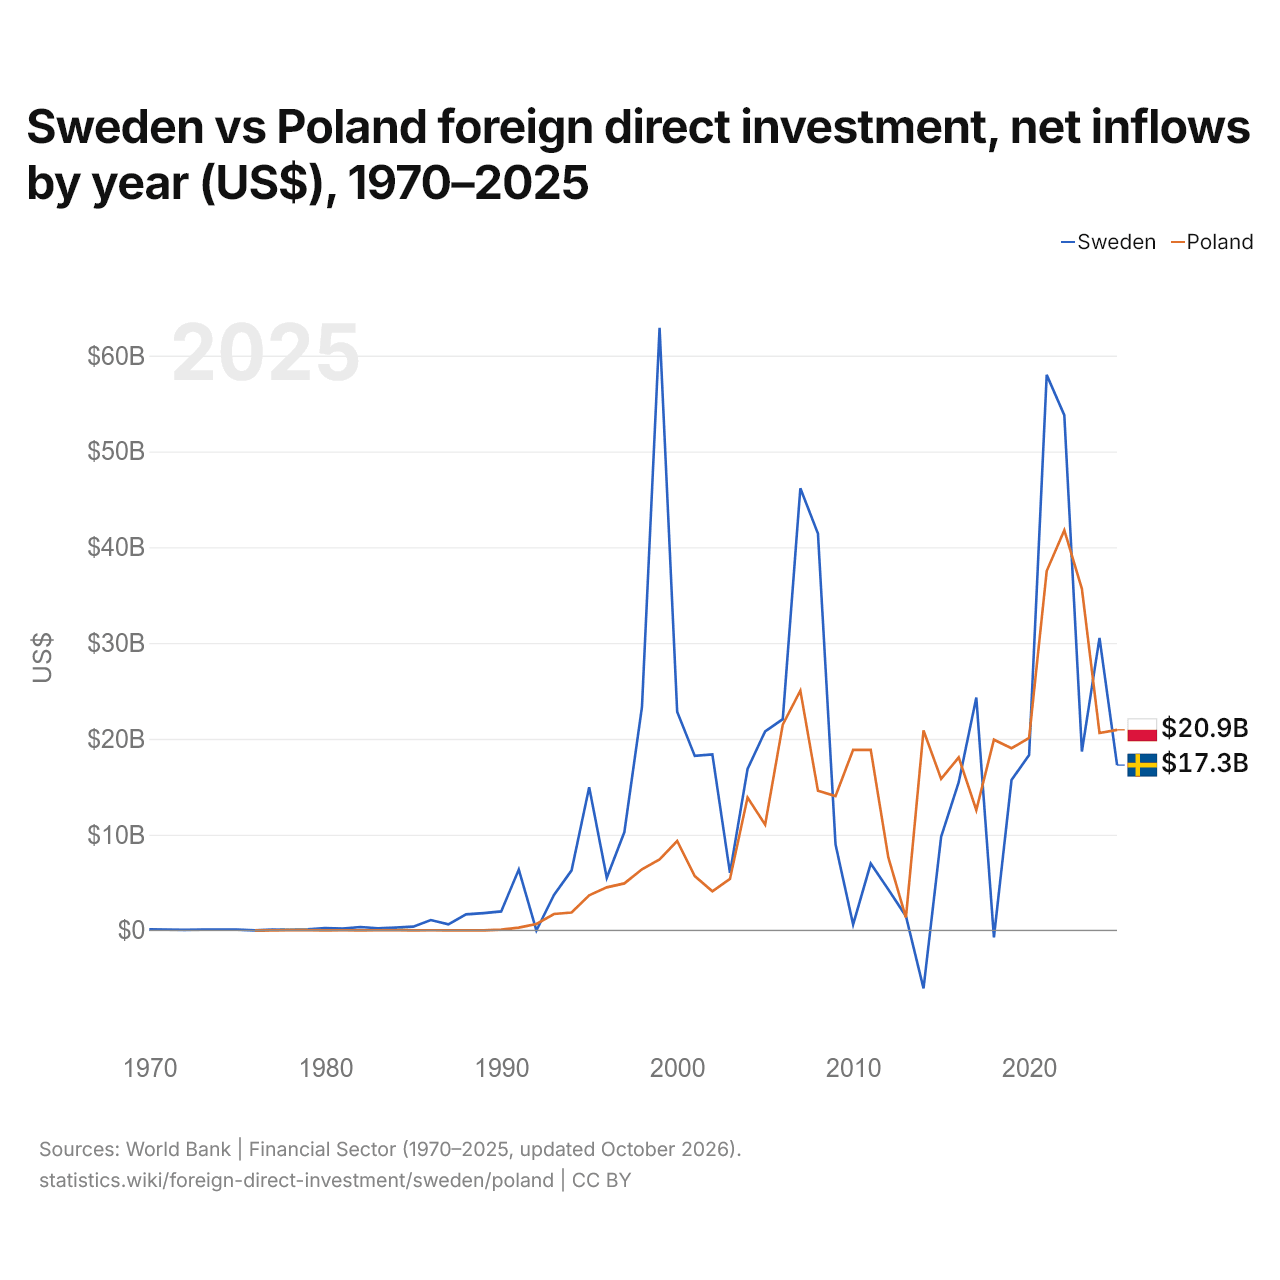
Suécia vs Polônia: investimento estrangeiro direto, entradas líquidas por ano (US$), 1970–2025
1x
| Ano | US$ | |
|---|---|---|
 Suécia |
 Polônia |
|
| 2025 | US$ 17.258.924.126 | US$ 20.940.000.000 |
| 2024 | US$ 30.533.470.372 | US$ 20.606.000.000 |
| 2023 | US$ 18.673.173.171 | US$ 35.660.000.000 |
| 2022 | US$ 53.782.285.500 | US$ 41.780.000.000 |
| 2021 | US$ 57.981.119.710 | US$ 37.512.000.000 |
| 2020 | US$ 18.307.766.875 | US$ 20.086.000.000 |
| 2019 | US$ 15.692.851.350 | US$ 19.012.000.000 |
| 2018 | US$ −714.153.381 | US$ 19.908.000.000 |
| 2017 | US$ 24.305.209.925 | US$ 12.565.000.000 |
| 2016 | US$ 15.470.455.706 | US$ 18.060.000.000 |
| 2015 | US$ 9.777.569.491 | US$ 15.820.000.000 |
| 2014 | US$ −6.039.792.920 | US$ 20.877.000.000 |
| 2013 | US$ 1.487.752.726 | US$ 1.342.000.000 |
| 2012 | US$ 4.273.531.542 | US$ 7.616.000.000 |
| 2011 | US$ 6.979.353.755 | US$ 18.851.000.000 |
| 2010 | US$ 625.102.142 | US$ 18.861.000.000 |
| 2009 | US$ 8.960.871.621 | US$ 14.025.000.000 |
| 2008 | US$ 41.436.553.996 | US$ 14.574.000.000 |
| 2007 | US$ 46.143.507.533 | US$ 25.031.000.000 |
| 2006 | US$ 22.052.656.379 | US$ 21.473.000.000 |
| 2005 | US$ 20.782.686.616 | US$ 11.041.000.000 |
| 2004 | US$ 16.854.649.894 | US$ 13.868.000.000 |
| 2003 | US$ 6.007.683.416 | US$ 5.371.000.000 |
| 2002 | US$ 18.381.645.408 | US$ 4.091.000.000 |
| 2001 | US$ 18.217.810.086 | US$ 5.677.000.000 |
| 2000 | US$ 22.817.836.821 | US$ 9.335.000.000 |
| 1999 | US$ 62.910.430.888 | US$ 7.407.000.000 |
| 1998 | US$ 23.334.866.535 | US$ 6.383.000.000 |
| 1997 | US$ 10.271.066.269 | US$ 4.910.000.000 |
| 1996 | US$ 5.491.883.748 | US$ 4.500.000.000 |
| 1995 | US$ 14.939.375.567 | US$ 3.659.000.000 |
| 1994 | US$ 6.268.780.978 | US$ 1.875.000.000 |
| 1993 | US$ 3.704.921.362 | US$ 1.715.000.000 |
| 1992 | US$ −5.418.690 | US$ 678.000.000 |
| 1991 | US$ 6.350.883.200 | US$ 291.000.000 |
| 1990 | US$ 1.982.424.728 | US$ 89.000.000 |
| 1989 | US$ 1.812.004.571 | US$ 11.000.000 |
| 1988 | US$ 1.673.425.168 | US$ 15.000.000 |
| 1987 | US$ 639.212.993 | US$ 12.000.000 |
| 1986 | US$ 1.082.656.171 | US$ 16.000.000 |
| 1985 | US$ 392.953.912 | US$ 15.000.000 |
| 1984 | US$ 290.015.353 | US$ 28.000.000 |
| 1983 | US$ 225.698.176 | US$ 16.000.000 |
| 1982 | US$ 355.014.409 | US$ 14.000.000 |
| 1981 | US$ 181.117.389 | US$ 18.000.000 |
| 1980 | US$ 250.911.513 | US$ 10.000.000 |
| 1979 | US$ 112.469.610 | US$ 30.000.000 |
| 1978 | US$ 69.712.037 | US$ 25.000.000 |
| 1977 | US$ 81.453.707 | US$ 5.000.000 |
| 1976 | US$ 4.864.300 | US$ 6.000.000 |
| 1975 | US$ 80.215.155 | - |
| 1974 | US$ 76.586.495 | - |
| 1973 | US$ 83.963.593 | - |
| 1972 | US$ 65.306.130 | - |
| 1971 | US$ 84.100.267 | - |
| 1970 | US$ 108.250.003 | - |
Em 2025, as entradas líquidas de investimento estrangeiro direto foram de US$ 17,3 bilhões na Suécia e de US$ 20,9 bilhões na Polônia: 21% a mais na Polônia. Em 1976, foram de US$ 4,86 milhões na Suécia e de US$ 6 milhões na Polônia.
As entradas líquidas de investimento estrangeiro direto na Suécia foram maiores que na Polônia em 36 dos 50 anos de 1976 a 2025, e menores em 14.
Suécia vs Polônia: entradas e saídas mais recentes de investimento estrangeiro
|
Suécia
|
Polônia
|
|
|---|---|---|
| Entradas líquidas | +US$ 17,3 bi | +US$ 20,9 bi |
| Entradas líquidas, % do PIB | +2,6% | +2,0% |
| Saídas líquidas | +US$ 7,36 bi | +US$ 8,24 bi |
| Entradas líquidas, total 2016–2025 | +US$ 251 bi | +US$ 246 bi |
| Posição mundial | 24/192 | 22/192 |
Comparar o investimento estrangeiro direto de 2 países quaisquer
Fontes:
- Banco Mundial | Financial Sector (1970–2025, atualizado em outubro de 2026)
Creative Commons Atribuição (CC BY): você pode copiar, compartilhar, adaptar e reutilizar este conteúdo, inclusive para fins comerciais, desde que cite o statistics.wiki e indique as alterações que fizer. As fontes listadas acima podem ter suas próprias condições de licença.