
Sri Lanka vs Japão: investimento estrangeiro direto, entradas líquidas por ano (US$), 1970–2025
1x
| Ano | US$ | |
|---|---|---|
 Sri Lanka |
 Japão |
|
| 2025 | US$ 1.043.936.118 | US$ 45.805.721.095 |
| 2024 | US$ 759.240.352 | US$ 18.874.093.729 |
| 2023 | US$ 713.015.365 | US$ 20.007.989.123 |
| 2022 | US$ 884.150.491 | US$ 48.153.832.744 |
| 2021 | US$ 592.289.970 | US$ 35.027.163.876 |
| 2020 | US$ 434.075.668 | US$ 62.584.719.398 |
| 2019 | US$ 743.466.231 | US$ 39.960.544.340 |
| 2018 | US$ 1.614.044.009 | US$ 25.289.367.858 |
| 2017 | US$ 1.372.723.043 | US$ 18.802.251.208 |
| 2016 | US$ 897.049.376 | US$ 40.954.181.469 |
| 2015 | US$ 679.655.644 | US$ 5.252.218.412 |
| 2014 | US$ 893.628.980 | US$ 19.752.249.424 |
| 2013 | US$ 932.551.318 | US$ 10.648.441.636 |
| 2012 | US$ 941.116.591 | US$ 546.962.692 |
| 2011 | US$ 955.920.000 | US$ −850.717.035 |
| 2010 | US$ 477.559.000 | US$ 7.440.979.284 |
| 2009 | US$ 404.000.000 | US$ 12.226.471.579 |
| 2008 | US$ 752.200.000 | US$ 24.624.845.330 |
| 2007 | US$ 603.000.000 | US$ 21.631.204.436 |
| 2006 | US$ 479.700.000 | US$ −2.396.909.736 |
| 2005 | US$ 272.400.000 | US$ 5.459.618.343 |
| 2004 | US$ 232.800.000 | US$ 7.527.948.175 |
| 2003 | US$ 228.720.000 | US$ 8.771.535.612 |
| 2002 | US$ 196.500.000 | US$ 11.557.373.874 |
| 2001 | US$ 171.790.000 | US$ 4.926.033.619 |
| 2000 | US$ 172.941.410 | US$ 10.688.168.326 |
| 1999 | US$ 176.410.171 | US$ 14.780.510.031 |
| 1998 | US$ 193.424.023 | US$ 2.512.021.924 |
| 1997 | US$ 430.056.152 | US$ 2.486.935.040 |
| 1996 | US$ 119.874.350 | US$ −38.203.596 |
| 1995 | US$ 55.995.588 | US$ 41.463.072 |
| 1994 | US$ 166.412.940 | US$ 888.384.471 |
| 1993 | US$ 194.479.070 | US$ 210.435.439 |
| 1992 | US$ 122.625.843 | US$ 2.755.603.983 |
| 1991 | US$ 48.349.174 | US$ 1.284.268.820 |
| 1990 | US$ 43.355.120 | US$ 1.806.039.008 |
| 1989 | US$ 19.741.313 | US$ −1.059.696.732 |
| 1988 | US$ 45.722.529 | US$ −483.800.487 |
| 1987 | US$ 59.504.202 | US$ 1.177.422.254 |
| 1986 | US$ 29.723.120 | US$ 242.107.762 |
| 1985 | US$ 26.162.080 | US$ 608.713.150 |
| 1984 | US$ 32.612.391 | US$ −10.000.000 |
| 1983 | US$ 37.778.898 | US$ 416.000.000 |
| 1982 | US$ 63.567.609 | US$ 439.000.000 |
| 1981 | US$ 49.264.554 | US$ 189.000.000 |
| 1980 | US$ 43.010.507 | US$ 278.000.000 |
| 1979 | US$ 46.911.742 | US$ 239.000.000 |
| 1978 | US$ 1.474.392 | US$ 8.000.000 |
| 1977 | US$ −1.218.567 | US$ 21.000.000 |
| 1976 | US$ 1.000 | US$ 113.000.000 |
| 1975 | US$ 142.711 | US$ 226.000.000 |
| 1974 | US$ 1.400.000 | US$ 202.000.000 |
| 1973 | US$ 500.000 | US$ −42.000.000 |
| 1972 | US$ 300.000 | US$ 169.000.000 |
| 1971 | US$ 300.000 | US$ 210.000.000 |
| 1970 | US$ −300.000 | US$ 94.000.000 |
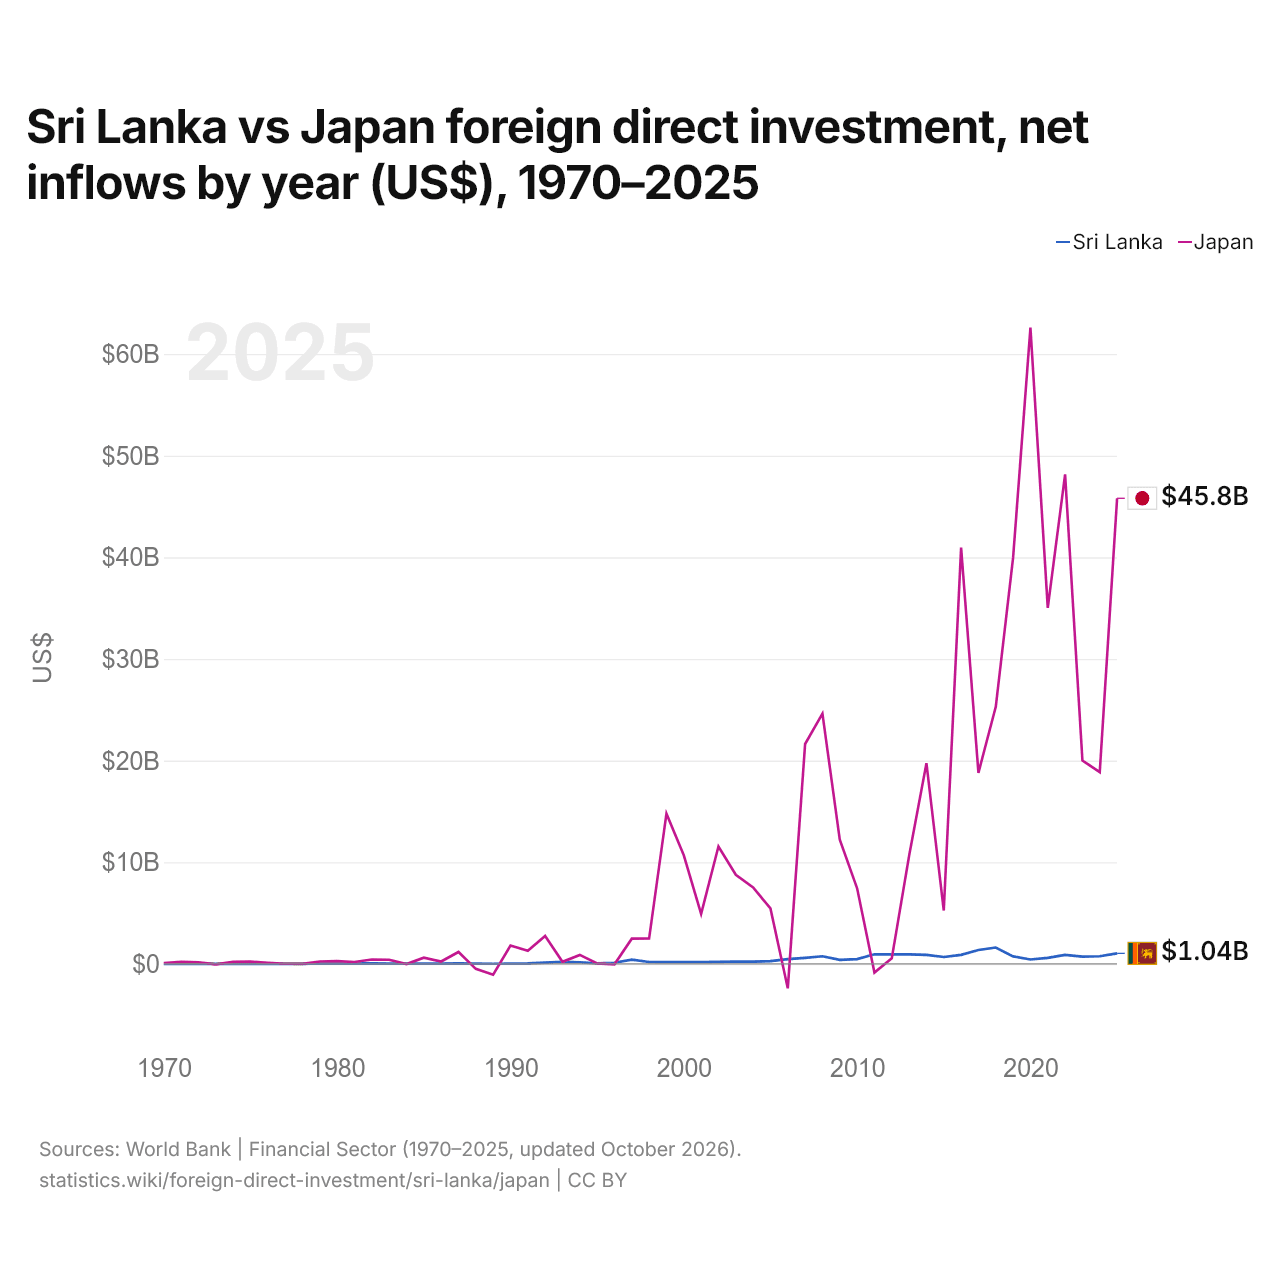
Em 2025, as entradas líquidas de investimento estrangeiro direto foram de US$ 1,04 bilhão no Sri Lanka e de US$ 45,8 bilhões no Japão: 44 vezes mais no Japão. Em 1970, foram negativas no Sri Lanka, de US$ 300.000 e de US$ 94 milhões no Japão.
As entradas líquidas de investimento estrangeiro direto no Sri Lanka foram maiores que no Japão em 9 dos 56 anos de 1970 a 2025, e menores em 47.
Sri Lanka vs Japão: entradas e saídas mais recentes de investimento estrangeiro
|
Sri Lanka
|
Japão
|
|
|---|---|---|
| Entradas líquidas | +US$ 1,04 bi | +US$ 45,8 bi |
| Entradas líquidas, % do PIB | +1,0% | +1,0% |
| Saídas líquidas | +US$ 98,2 mi | +US$ 218 bi |
| Entradas líquidas, total 2016–2025 | +US$ 9,05 bi | +US$ 355 bi |
| Posição mundial | 92/192 | 10/192 |
Comparar o investimento estrangeiro direto de 2 países quaisquer
Fontes:
- Banco Mundial | Financial Sector (1970–2025, atualizado em outubro de 2026)
Creative Commons Atribuição (CC BY): você pode copiar, compartilhar, adaptar e reutilizar este conteúdo, inclusive para fins comerciais, desde que cite o statistics.wiki e indique as alterações que fizer. As fontes listadas acima podem ter suas próprias condições de licença.