
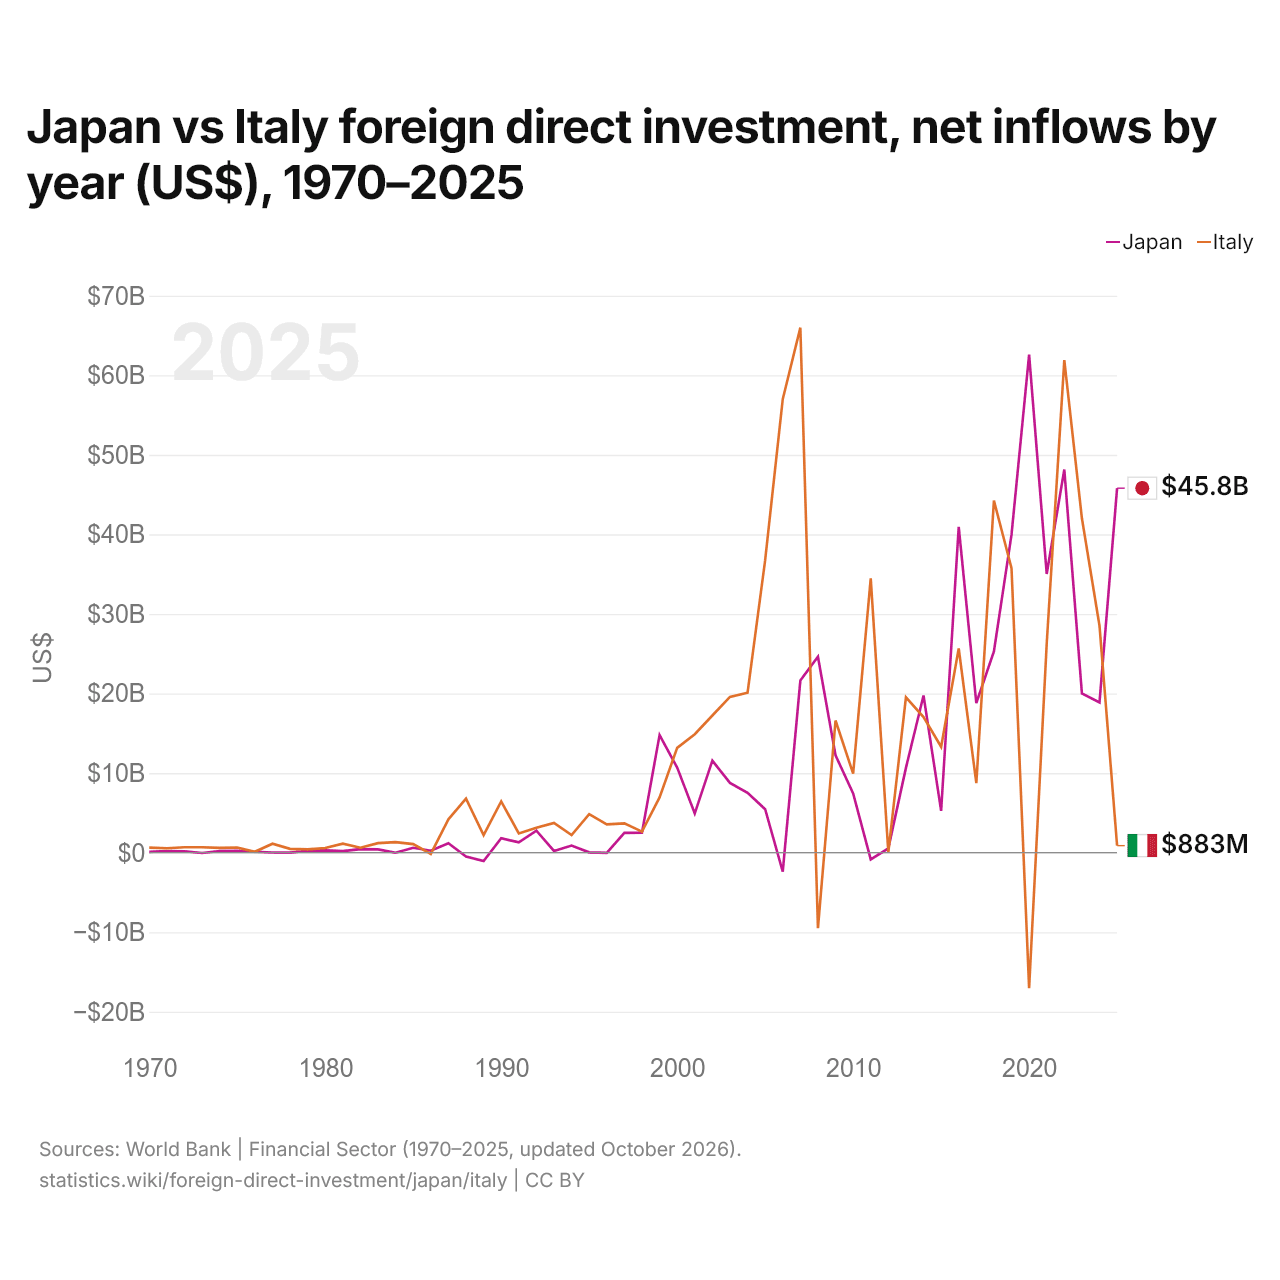
Japão vs Itália: investimento estrangeiro direto, entradas líquidas por ano (US$), 1970–2025
1x
| Ano | US$ | |
|---|---|---|
 Japão |
 Itália |
|
| 2025 | US$ 45.805.721.095 | US$ 882.914.836 |
| 2024 | US$ 18.874.093.729 | US$ 28.511.444.638 |
| 2023 | US$ 20.007.989.123 | US$ 42.019.753.074 |
| 2022 | US$ 48.153.832.744 | US$ 61.897.757.338 |
| 2021 | US$ 35.027.163.876 | US$ 26.253.856.510 |
| 2020 | US$ 62.584.719.398 | US$ −17.050.399.621 |
| 2019 | US$ 39.960.544.340 | US$ 35.760.550.299 |
| 2018 | US$ 25.289.367.858 | US$ 44.249.715.319 |
| 2017 | US$ 18.802.251.208 | US$ 8.737.024.579 |
| 2016 | US$ 40.954.181.469 | US$ 25.656.663.795 |
| 2015 | US$ 5.252.218.412 | US$ 13.303.439.230 |
| 2014 | US$ 19.752.249.424 | US$ 17.032.744.039 |
| 2013 | US$ 10.648.441.636 | US$ 19.531.411.962 |
| 2012 | US$ 546.962.692 | US$ 34.901.033 |
| 2011 | US$ −850.717.035 | US$ 34.465.481.830 |
| 2010 | US$ 7.440.979.284 | US$ 9.930.501.391 |
| 2009 | US$ 12.226.471.579 | US$ 16.607.196.345 |
| 2008 | US$ 24.624.845.330 | US$ −9.501.579.210 |
| 2007 | US$ 21.631.204.436 | US$ 65.975.535.145 |
| 2006 | US$ −2.396.909.736 | US$ 56.995.485.107 |
| 2005 | US$ 5.459.618.343 | US$ 36.762.073.075 |
| 2004 | US$ 7.527.948.175 | US$ 20.100.742.902 |
| 2003 | US$ 8.771.535.612 | US$ 19.572.886.734 |
| 2002 | US$ 11.557.373.874 | US$ 17.239.360.005 |
| 2001 | US$ 4.926.033.619 | US$ 14.878.086.499 |
| 2000 | US$ 10.688.168.326 | US$ 13.172.981.900 |
| 1999 | US$ 14.780.510.031 | US$ 6.941.768.225 |
| 1998 | US$ 2.512.021.924 | US$ 2.640.065.101 |
| 1997 | US$ 2.486.935.040 | US$ 3.687.266.506 |
| 1996 | US$ −38.203.596 | US$ 3.548.937.154 |
| 1995 | US$ 41.463.072 | US$ 4.843.882.770 |
| 1994 | US$ 888.384.471 | US$ 2.208.555.823 |
| 1993 | US$ 210.435.439 | US$ 3.738.910.088 |
| 1992 | US$ 2.755.603.983 | US$ 3.118.551.015 |
| 1991 | US$ 1.284.268.820 | US$ 2.403.349.144 |
| 1990 | US$ 1.806.039.008 | US$ 6.440.765.876 |
| 1989 | US$ −1.059.696.732 | US$ 2.191.462.724 |
| 1988 | US$ −483.800.487 | US$ 6.789.447.589 |
| 1987 | US$ 1.177.422.254 | US$ 4.188.118.187 |
| 1986 | US$ 242.107.762 | US$ −153.004.673 |
| 1985 | US$ 608.713.150 | US$ 1.066.817.196 |
| 1984 | US$ −10.000.000 | US$ 1.313.182.672 |
| 1983 | US$ 416.000.000 | US$ 1.194.907.475 |
| 1982 | US$ 439.000.000 | US$ 615.183.541 |
| 1981 | US$ 189.000.000 | US$ 1.124.409.633 |
| 1980 | US$ 278.000.000 | US$ 578.156.245 |
| 1979 | US$ 239.000.000 | US$ 415.373.573 |
| 1978 | US$ 8.000.000 | US$ 477.670.645 |
| 1977 | US$ 21.000.000 | US$ 1.129.034.015 |
| 1976 | US$ 113.000.000 | US$ 109.235.548 |
| 1975 | US$ 226.000.000 | US$ 644.515.568 |
| 1974 | US$ 202.000.000 | US$ 595.350.461 |
| 1973 | US$ −42.000.000 | US$ 673.103.003 |
| 1972 | US$ 169.000.000 | US$ 673.181.132 |
| 1971 | US$ 210.000.000 | US$ 549.089.965 |
| 1970 | US$ 94.000.000 | US$ 624.159.999 |
Em 2025, as entradas líquidas de investimento estrangeiro direto foram de US$ 45,8 bilhões no Japão e de US$ 883 milhões na Itália: 52 vezes mais no Japão. Em 1970, foram de US$ 94 milhões no Japão e de US$ 624 milhões na Itália.
As entradas líquidas de investimento estrangeiro direto no Japão foram maiores que na Itália em 12 dos 56 anos de 1970 a 2025, e menores em 44.
Japão vs Itália: entradas e saídas mais recentes de investimento estrangeiro
|
Japão
|
Itália
|
|
|---|---|---|
| Entradas líquidas | +US$ 45,8 bi | +US$ 883 mi |
| Entradas líquidas, % do PIB | +1,0% | +0,0% |
| Saídas líquidas | +US$ 218 bi | +US$ 22,9 bi |
| Entradas líquidas, total 2016–2025 | +US$ 355 bi | +US$ 257 bi |
| Posição mundial | 10/192 | 97/192 |
Comparar o investimento estrangeiro direto de 2 países quaisquer
Fontes:
- Banco Mundial | Financial Sector (1970–2025, atualizado em outubro de 2026)
Creative Commons Atribuição (CC BY): você pode copiar, compartilhar, adaptar e reutilizar este conteúdo, inclusive para fins comerciais, desde que cite o statistics.wiki e indique as alterações que fizer. As fontes listadas acima podem ter suas próprias condições de licença.